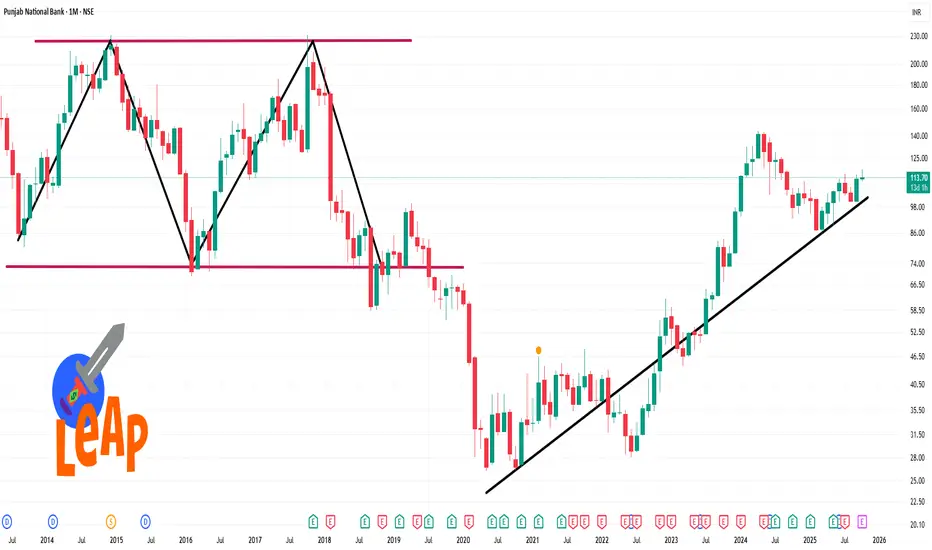
📊 Key Technical Indicators
Relative Strength Index (RSI): The 14-day RSI is approximately 59.6, suggesting the stock is neither overbought nor oversold, indicating a neutral stance.
Moving Averages:
20-day Simple Moving Average (SMA): 113.73 (bullish)
50-day SMA: 113.61 (bullish)
200-day SMA: 113.87 (bearish)
20-day Exponential Moving Average (EMA): 113.75 (bullish)
50-day EMA: 113.66 (bullish)
200-day EMA: 113.97 (bearish)
Moving Average Convergence Divergence (MACD): The MACD is positive, indicating bullish momentum.
Commodity Channel Index (CCI): The CCI is at 462.41, which is considered extremely overbought, suggesting potential for a pullback.
🔍 Support and Resistance Levels
Resistance: 117.24
Support: 111.4
İlgili yayınlar
Feragatname
Bilgiler ve yayınlar, TradingView tarafından sağlanan veya onaylanan finansal, yatırım, alım satım veya diğer türden tavsiye veya öneriler anlamına gelmez ve teşkil etmez. Kullanım Koşulları bölümünde daha fazlasını okuyun.
İlgili yayınlar
Feragatname
Bilgiler ve yayınlar, TradingView tarafından sağlanan veya onaylanan finansal, yatırım, alım satım veya diğer türden tavsiye veya öneriler anlamına gelmez ve teşkil etmez. Kullanım Koşulları bölümünde daha fazlasını okuyun.