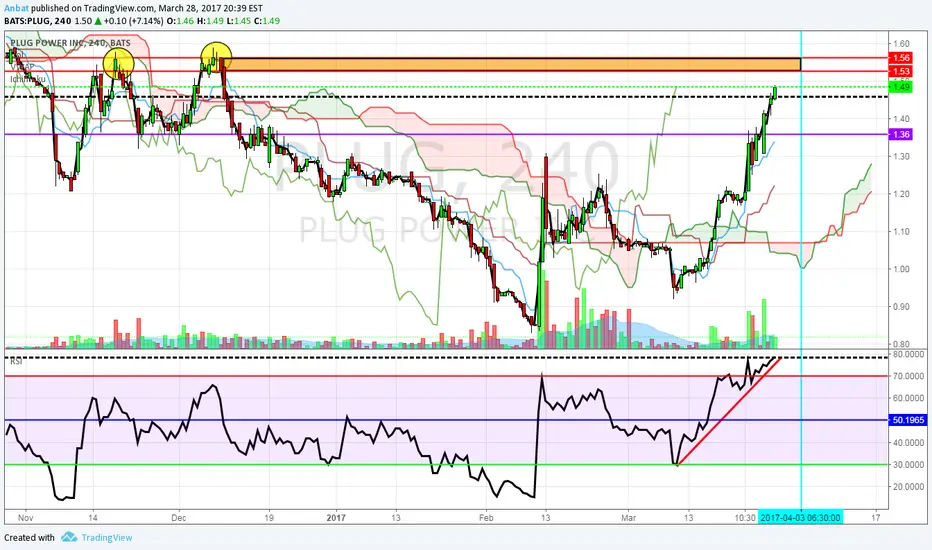
From 4 hour chart of PLUG- tomorrow's trading will initially go up to in between $1.53 to $1.56, then look LEFT on chart. This is a resistance area since 11/2016 (November). On lower either intra daily or 1 mn time frames, will be going long or with TREND beginning of trading, but when price reversal zone noted above (orange area on chart) is violated by PA & RSI indicator below (red line) is broken, will be looking for bears/sell or put trades until support level of $1.36 (purple line).
This is my opinion, on tomorrow's trading from my research and looking at big to small picture. I used this 4 hr chart related to showing resistance to left of current price action. Trade at your own risk & understand support and resistance levels. Price action is king & using your eyes/brain.
This is my opinion, on tomorrow's trading from my research and looking at big to small picture. I used this 4 hr chart related to showing resistance to left of current price action. Trade at your own risk & understand support and resistance levels. Price action is king & using your eyes/brain.
Feragatname
Bilgiler ve yayınlar, TradingView tarafından sağlanan veya onaylanan finansal, yatırım, işlem veya diğer türden tavsiye veya tavsiyeler anlamına gelmez ve teşkil etmez. Kullanım Şartları'nda daha fazlasını okuyun.
Feragatname
Bilgiler ve yayınlar, TradingView tarafından sağlanan veya onaylanan finansal, yatırım, işlem veya diğer türden tavsiye veya tavsiyeler anlamına gelmez ve teşkil etmez. Kullanım Şartları'nda daha fazlasını okuyun.