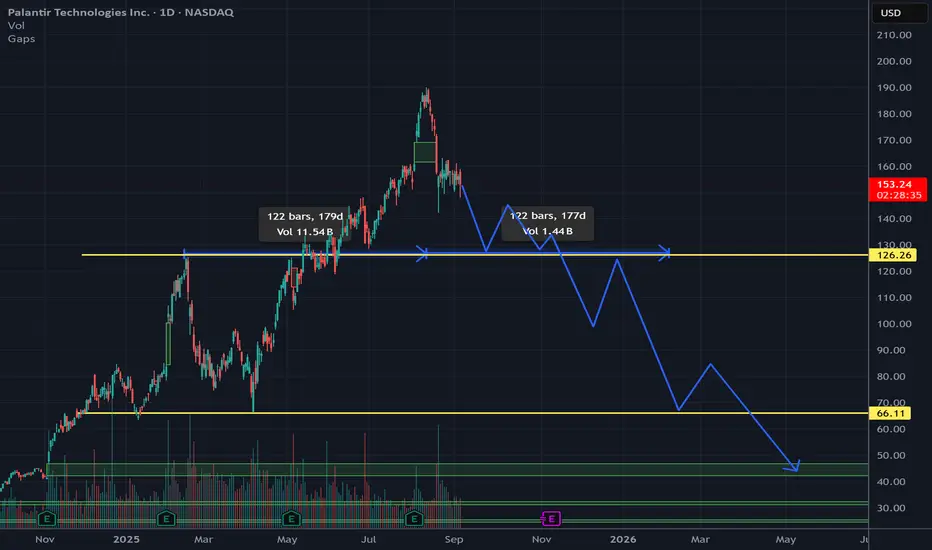
Over 180 days, PLTR climbed aggressively, fueled by high conviction buying. With candlesticks showing strong green bodies and upside momentum, peaking near the $190 52-week high.
This analysis focuses on the fractal comparison in the chart, forecasting an extended bearish phase that could drag the stock significantly lower before any stabilization.
I predict PLTR enters an extended correction phase. This fractal symmetry suggests the downside could match or exceed the prior upside's duration and magnitude, projecting a measured move toward $65 or lower
Feragatname
Bilgiler ve yayınlar, TradingView tarafından sağlanan veya onaylanan finansal, yatırım, işlem veya diğer türden tavsiye veya tavsiyeler anlamına gelmez ve teşkil etmez. Kullanım Şartları'nda daha fazlasını okuyun.
Feragatname
Bilgiler ve yayınlar, TradingView tarafından sağlanan veya onaylanan finansal, yatırım, işlem veya diğer türden tavsiye veya tavsiyeler anlamına gelmez ve teşkil etmez. Kullanım Şartları'nda daha fazlasını okuyun.