$PLTR Palentir - 4 hour - trend matrix development
A trend matrix, also known as a trend analysis matrix, is a tool used to analyze and visualize trends in data over time. It helps in identifying patterns, making forecasts, and making informed decisions based on historical data. Developing a trend matrix involves several steps:
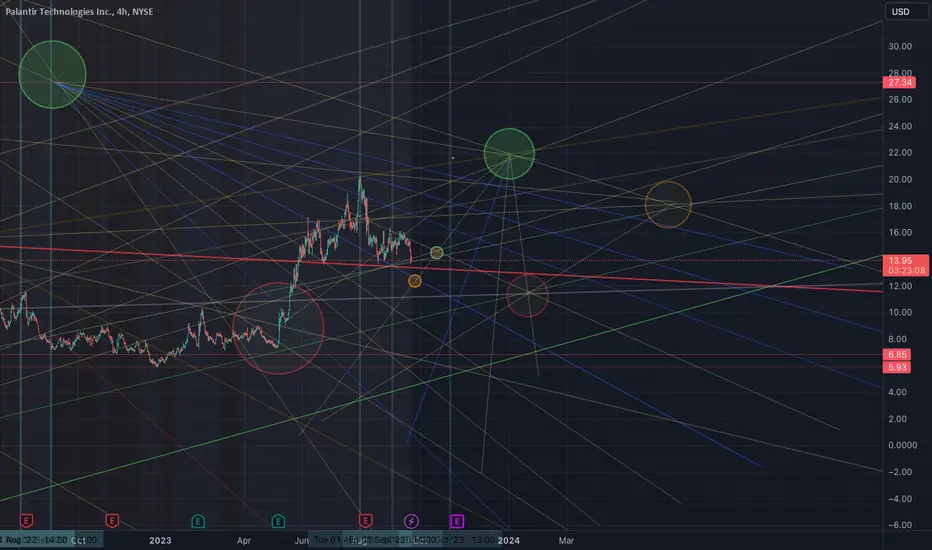
A geometric trendline matrix is a visual representation of geometric trends in data over time. Geometric trends are characterized by a constant ratio of change rather than a constant amount of change, which is typical of linear trends.
The ratio degrades to a 0 point hub. Which often acts as a sort of cog to the movement of the dataflow.
This is a 4 hour chart of Palentir
Feragatname
Bilgiler ve yayınlar, TradingView tarafından sağlanan veya onaylanan finansal, yatırım, işlem veya diğer türden tavsiye veya tavsiyeler anlamına gelmez ve teşkil etmez. Kullanım Şartları'nda daha fazlasını okuyun.
Feragatname
Bilgiler ve yayınlar, TradingView tarafından sağlanan veya onaylanan finansal, yatırım, işlem veya diğer türden tavsiye veya tavsiyeler anlamına gelmez ve teşkil etmez. Kullanım Şartları'nda daha fazlasını okuyun.