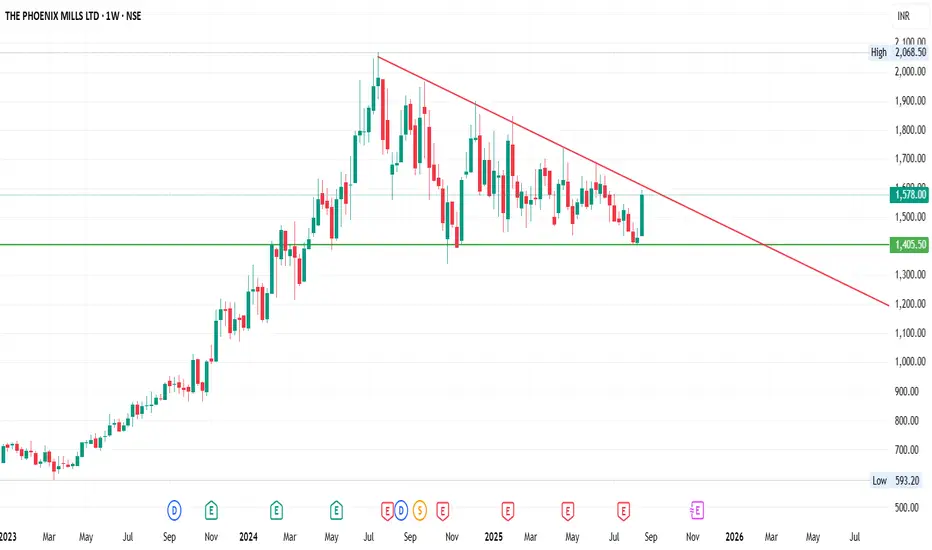
Chart Pattern: On the weekly chart, Phoenix Ltd. is forming a triangle consolidation pattern after a strong prior uptrend.
Technical View
Support Zone: ₹1400 (strong base, tested multiple times).
Resistance Trendline: Descending resistance capping the upside.
Volume: Watch for a surge in volume to confirm breakout direction.
Breakout Levels:
What do you think? Will Phoenix Ltd. break upwards or downwards? Drop your views below!
Disclaimer: This analysis is for educational purposes only, not financial advice. Please do your own research before investing.
- The descending trendline (red) is acting as resistance.
- A strong horizontal support zone near ₹1400 (green) has been tested multiple times, showing buyers’ interest at this level.
- Price action is currently squeezing inside the triangle, indicating that a big breakout move may be near.
Technical View
Support Zone: ₹1400 (strong base, tested multiple times).
Resistance Trendline: Descending resistance capping the upside.
Volume: Watch for a surge in volume to confirm breakout direction.
Breakout Levels:
- Bullish breakout above the descending trendline could open up targets towards ₹1600–₹1700.
- Be
What do you think? Will Phoenix Ltd. break upwards or downwards? Drop your views below!
Disclaimer: This analysis is for educational purposes only, not financial advice. Please do your own research before investing.
Feragatname
Bilgiler ve yayınlar, TradingView tarafından sağlanan veya onaylanan finansal, yatırım, alım satım veya diğer türden tavsiye veya öneriler anlamına gelmez ve teşkil etmez. Kullanım Koşulları bölümünde daha fazlasını okuyun.
Feragatname
Bilgiler ve yayınlar, TradingView tarafından sağlanan veya onaylanan finansal, yatırım, alım satım veya diğer türden tavsiye veya öneriler anlamına gelmez ve teşkil etmez. Kullanım Koşulları bölümünde daha fazlasını okuyun.
