Identifying when to enter a stock?
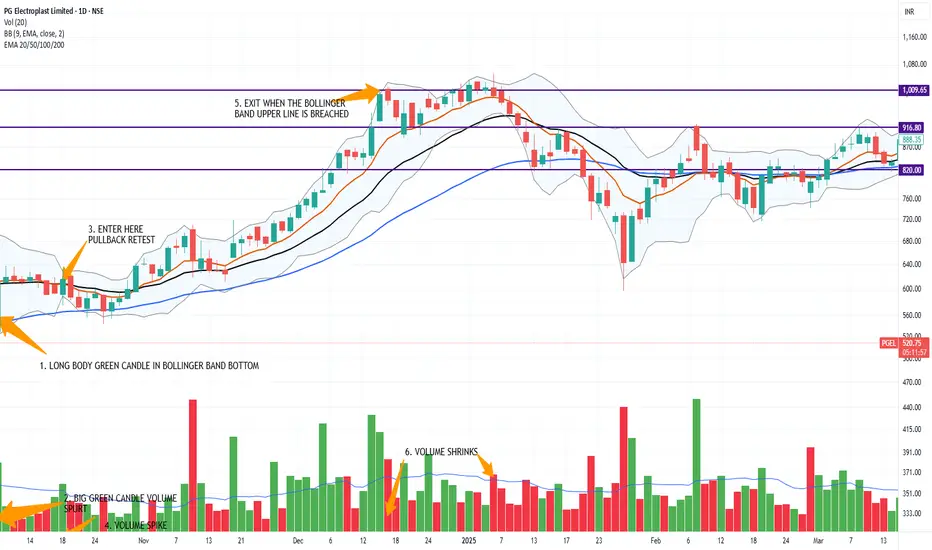
Indicator Set Up Required: Bollinger Band, 9 EMA (Orange Line), 21 EMA (Black Line), 50 EMA line (Blue Line), Volume
Wait for the formation of Long body Green Candle.
Ensure that the candle forms near the bottom of Bollinger Band.
Confirm the Big Volume spurt.
Can enter the next day or after pullback to 21 EMA (Blackline).
You can exit when the stock touches upper bolliner band when volume shrinks.
Note: This setup works most of the time.
However, backtest the strategy before trying in the market.
You can keep stoploss below 50 EMA line or 21 EMA line.
Feragatname
Bilgiler ve yayınlar, TradingView tarafından sağlanan veya onaylanan finansal, yatırım, alım satım veya diğer türden tavsiye veya öneriler anlamına gelmez ve teşkil etmez. Kullanım Koşulları bölümünde daha fazlasını okuyun.
Feragatname
Bilgiler ve yayınlar, TradingView tarafından sağlanan veya onaylanan finansal, yatırım, alım satım veya diğer türden tavsiye veya öneriler anlamına gelmez ve teşkil etmez. Kullanım Koşulları bölümünde daha fazlasını okuyun.