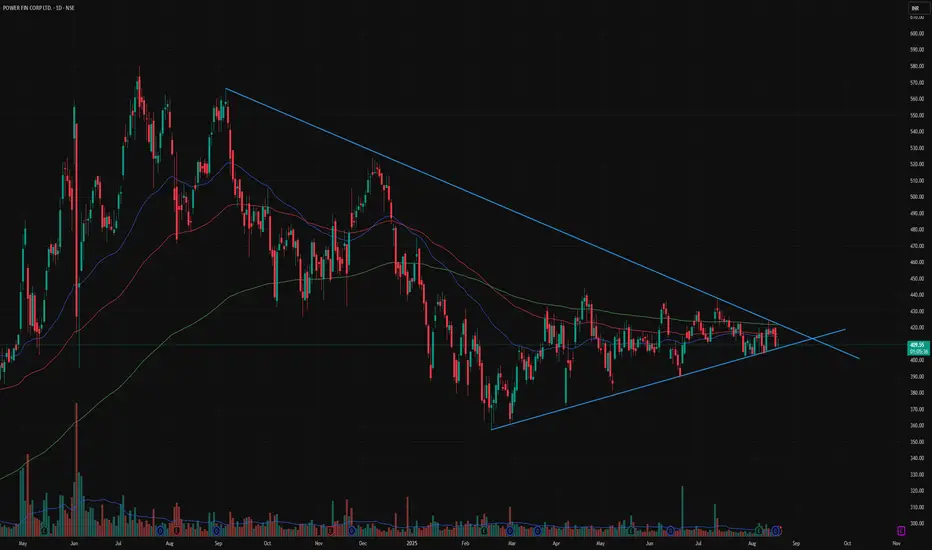
📊 Stock: Power Finance Corporation (PFC)
🔹 Symmetrical triangle pattern forming – price squeezing into apex
🔹 Long consolidation with volume stability – accumulation signs visible
🔹 Holding support near rising trendline (₹405–410)
🔹 Facing resistance near falling trendline (₹425–430)
🔹 Trading around 50, 100 & 200 DMA cluster – decisive move expected
🔹 RSI hovering near neutral – waiting for direction
🔹 Fundamentally strong PSU with consistent dividend payouts
⚡ Price tightening near breakout zone (₹425–430)
🚀 Breakout above resistance could trigger 20–25% rally towards ₹500+
⚠️ Breakdown below ₹400 may drag stock back to ₹370 levels.
Feragatname
Bilgiler ve yayınlar, TradingView tarafından sağlanan veya onaylanan finansal, yatırım, alım satım veya diğer türden tavsiye veya öneriler anlamına gelmez ve teşkil etmez. Kullanım Koşulları bölümünde daha fazlasını okuyun.
Feragatname
Bilgiler ve yayınlar, TradingView tarafından sağlanan veya onaylanan finansal, yatırım, alım satım veya diğer türden tavsiye veya öneriler anlamına gelmez ve teşkil etmez. Kullanım Koşulları bölümünde daha fazlasını okuyun.