Hello guys!
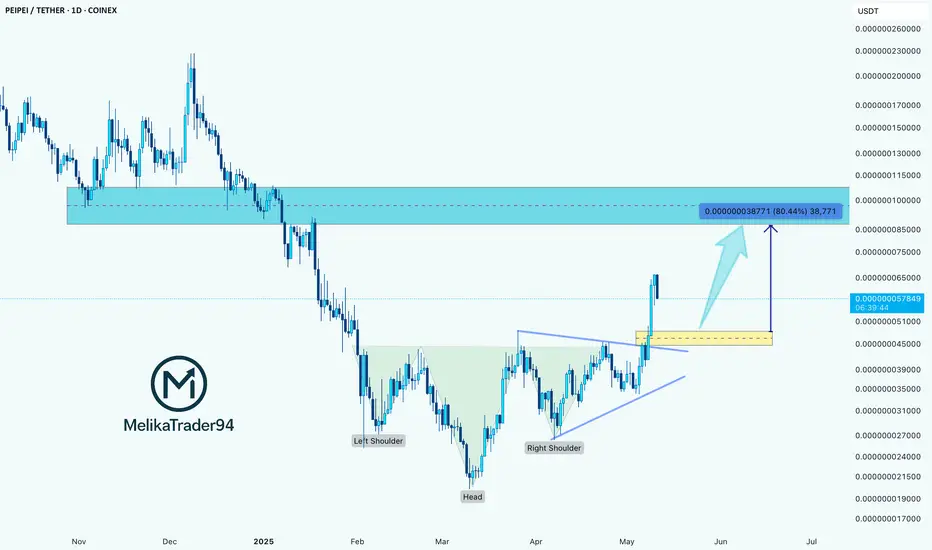
The PEiPEi/USDT daily chart presents a textbook inverse head and shoulders pattern, a classic bullish reversal formation. The structure is clearly labeled on the chart:
Key Zones:
The PEiPEi/USDT daily chart presents a textbook inverse head and shoulders pattern, a classic bullish reversal formation. The structure is clearly labeled on the chart:
- Left Shoulder: Formed in late January.
- Head: Deep retracement bottoming in early March.
- Right Shoulder: Completed in April with higher lows.
- Neckline: Shown with a breakout accompanied by strong bullish momentum.
- Following the breakout above the neckline, price action surged, breaking above a consolidation wedge and validating the pattern. The breakout is supported by volume and momentum, indicating strong bullish conviction.
Key Zones:
- Breakout Level (Yellow Box): Around 0.000000045 – 0.000000050 USDT, acting as immediate support on a retest.
- Target Zone (Blue Box): Marked around 0.000000085 – 0.000000100 USDT, representing a projected 80% upside move from the breakout point. This target aligns with a previous major supply/resistance zone from late 2024.
İşlem aktif
Proud ThinkMarkets Ambassador -> Discover & Grow: bit.ly/Think-Markets
------
My recommended Exchange -> YEX: bit.ly/YEX-M
------
Telegram channel: t.me/melikatrader94
Forex channel: t.me/melikatrader94GoldForex
------
My recommended Exchange -> YEX: bit.ly/YEX-M
------
Telegram channel: t.me/melikatrader94
Forex channel: t.me/melikatrader94GoldForex
İlgili yayınlar
Feragatname
Bilgiler ve yayınlar, TradingView tarafından sağlanan veya onaylanan finansal, yatırım, alım satım veya diğer türden tavsiye veya öneriler anlamına gelmez ve teşkil etmez. Kullanım Koşulları bölümünde daha fazlasını okuyun.