Chart Analysis:
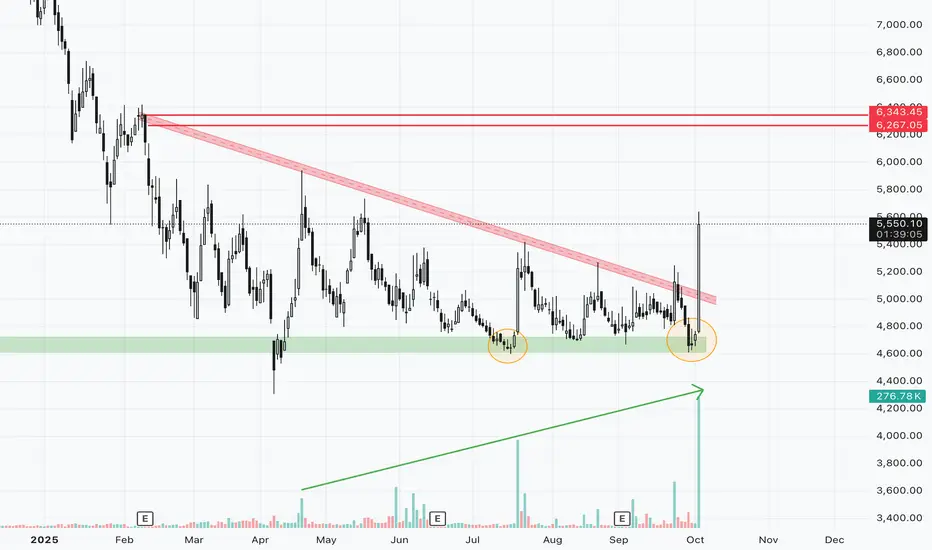
The stock has formed a flat base pattern and is now showing a breakout with strong volumes, indicating strength in the move. The weekly chart structure also supports the bullish outlook. A long position can be considered around the 5400–5450 zone.
Key Levels:
•Entry: 5400–5450
•Targets: 5750 / 5930 / 6130 / 6300
•Stop-loss (short term): Daily close below 5200 (strict SL for smaller targets)
•Stop-loss (positional 3–4 months): Daily close below 4700
Disclaimer:
I am not SEBI registered. This analysis is for educational purposes only and not investment advice. Please do your own research before trading or investing.
Feragatname
Bilgiler ve yayınlar, TradingView tarafından sağlanan veya onaylanan finansal, yatırım, işlem veya diğer türden tavsiye veya tavsiyeler anlamına gelmez ve teşkil etmez. Kullanım Şartları'nda daha fazlasını okuyun.
Feragatname
Bilgiler ve yayınlar, TradingView tarafından sağlanan veya onaylanan finansal, yatırım, işlem veya diğer türden tavsiye veya tavsiyeler anlamına gelmez ve teşkil etmez. Kullanım Şartları'nda daha fazlasını okuyun.