📊 Intraday Support & Resistance Levels
Support Levels:
₹201.10
₹199.70
₹198.60
Resistance Levels:
₹203.50
₹204.70
₹206.00
These levels are derived from recent price action and pivot point analysis.
🔍 Technical Indicators
Relative Strength Index (RSI): 62.39 — indicates a bullish momentum without being overbought.
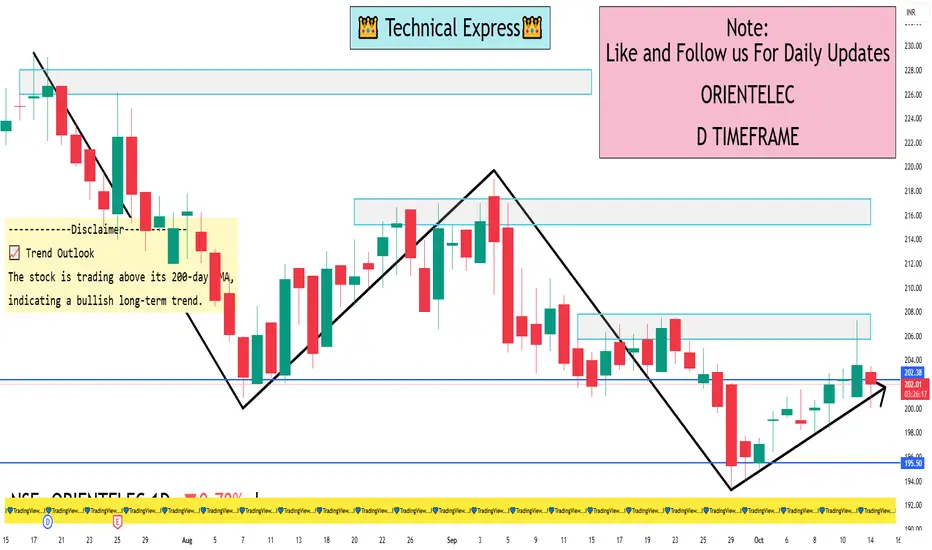
Moving Averages: The stock is above its 200-day exponential moving average (EMA), suggesting a positive long-term trend.
MACD: Neutral at 0.000, implying no strong directional momentum.
🔁 Pivot Points (Daily)
Central Pivot Point: ₹202.18
Resistance: ₹203.54 (R1), ₹204.65 (R2), ₹206.01 (R3)
Support: ₹201.07 (S1), ₹199.71 (S2), ₹198.60 (S3)
These levels are based on standard pivot point calculations and can help identify potential reversal zones.
Support Levels:
₹201.10
₹199.70
₹198.60
Resistance Levels:
₹203.50
₹204.70
₹206.00
These levels are derived from recent price action and pivot point analysis.
🔍 Technical Indicators
Relative Strength Index (RSI): 62.39 — indicates a bullish momentum without being overbought.
Moving Averages: The stock is above its 200-day exponential moving average (EMA), suggesting a positive long-term trend.
MACD: Neutral at 0.000, implying no strong directional momentum.
🔁 Pivot Points (Daily)
Central Pivot Point: ₹202.18
Resistance: ₹203.54 (R1), ₹204.65 (R2), ₹206.01 (R3)
Support: ₹201.07 (S1), ₹199.71 (S2), ₹198.60 (S3)
These levels are based on standard pivot point calculations and can help identify potential reversal zones.
I built a Buy & Sell Signal Indicator with 85% accuracy.
📈 Get access via DM or
WhatsApp: wa.link/d997q0
| Email: techncialexpress@gmail.com
| Script Coder | Trader | Investor | From India
📈 Get access via DM or
WhatsApp: wa.link/d997q0
| Email: techncialexpress@gmail.com
| Script Coder | Trader | Investor | From India
İlgili yayınlar
Feragatname
Bilgiler ve yayınlar, TradingView tarafından sağlanan veya onaylanan finansal, yatırım, işlem veya diğer türden tavsiye veya tavsiyeler anlamına gelmez ve teşkil etmez. Kullanım Şartları'nda daha fazlasını okuyun.