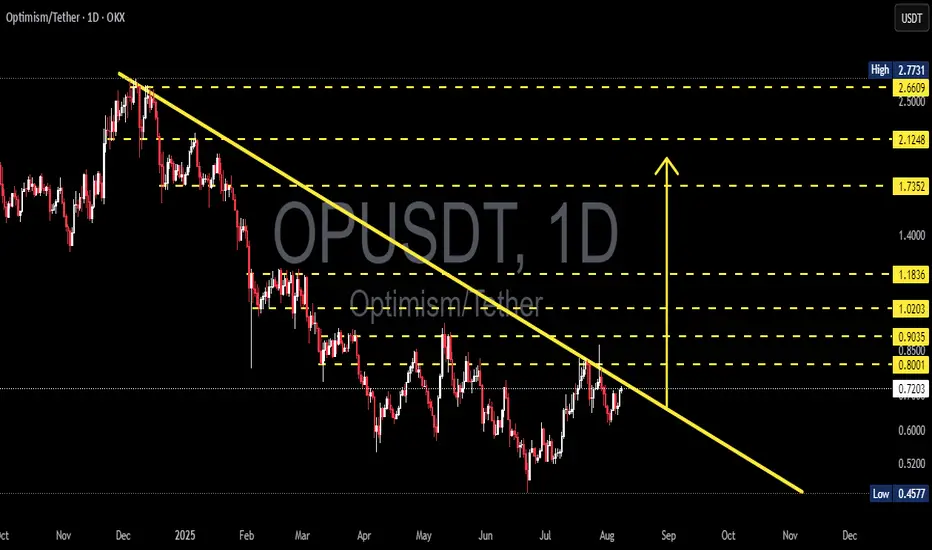
Chart Overview: The OP/USDT pair on the 1D (Daily) timeframe is currently moving within a long-term descending trendline, forming a descending triangle or falling resistance channel since November 2024. The price is now approaching a critical point near the long-term resistance trendline (yellow line), which has been tested multiple times.
---
🟢 Bullish Scenario: Breakout Potential
If the price manages to break and close above the descending trendline resistance (currently near the $0.80–$0.85 zone), it would signal a strong bullish breakout. The next key resistance levels to watch (based on yellow dotted horizontal lines) are:
1. $0.9035 – minor resistance
2. $1.0203 – psychological level
3. $1.1836 – mid-term strong resistance
4. $1.7352 and $2.1248 – extended bullish targets
A confirmed breakout would ideally be supported by increasing volume and RSI momentum above 50.
---
🔴 Bearish Scenario: Rejection at Resistance
If the price fails to break the trendline and gets rejected, a downside move is likely to follow. Key support levels to watch are:
1. $0.7200 – current support
2. $0.6000 – minor support
3. $0.4577 – strong historical support (lowest level)
This would suggest continued bearish control and could extend the downtrend that has lasted over 8 months.
---
📊 Pattern Breakdown: Descending Trendline
Consistent lower highs since the peak near $2.77
The descending trendline is the main battle zone between bulls and bears
This pattern often leads to a breakout if buyers gain momentum
---
🎯 Conclusion & Strategy:
This is a critical zone for OP/USDT.
Traders should wait for breakout confirmation before entering long positions.
For breakout traders: consider a buy-the-breakout strategy with stop-loss below the trendline.
For short sellers: look for a rejection at resistance with targets at the nearest support levels.
#OPUSDT #CryptoAnalysis #Altcoins #TechnicalAnalysis #BreakoutTrade #Optimism #CryptoSetup #BullishScenario #BearishScenario #ChartPatterns
---
🟢 Bullish Scenario: Breakout Potential
If the price manages to break and close above the descending trendline resistance (currently near the $0.80–$0.85 zone), it would signal a strong bullish breakout. The next key resistance levels to watch (based on yellow dotted horizontal lines) are:
1. $0.9035 – minor resistance
2. $1.0203 – psychological level
3. $1.1836 – mid-term strong resistance
4. $1.7352 and $2.1248 – extended bullish targets
A confirmed breakout would ideally be supported by increasing volume and RSI momentum above 50.
---
🔴 Bearish Scenario: Rejection at Resistance
If the price fails to break the trendline and gets rejected, a downside move is likely to follow. Key support levels to watch are:
1. $0.7200 – current support
2. $0.6000 – minor support
3. $0.4577 – strong historical support (lowest level)
This would suggest continued bearish control and could extend the downtrend that has lasted over 8 months.
---
📊 Pattern Breakdown: Descending Trendline
Consistent lower highs since the peak near $2.77
The descending trendline is the main battle zone between bulls and bears
This pattern often leads to a breakout if buyers gain momentum
---
🎯 Conclusion & Strategy:
This is a critical zone for OP/USDT.
Traders should wait for breakout confirmation before entering long positions.
For breakout traders: consider a buy-the-breakout strategy with stop-loss below the trendline.
For short sellers: look for a rejection at resistance with targets at the nearest support levels.
#OPUSDT #CryptoAnalysis #Altcoins #TechnicalAnalysis #BreakoutTrade #Optimism #CryptoSetup #BullishScenario #BearishScenario #ChartPatterns
✅ Get Free Signals! Join Our Telegram Channel Here: t.me/TheCryptoNuclear
✅ Twitter: twitter.com/crypto_nuclear
✅ Join Bybit : partner.bybit.com/b/nuclearvip
✅ Benefits : Lifetime Trading Fee Discount -50%
✅ Twitter: twitter.com/crypto_nuclear
✅ Join Bybit : partner.bybit.com/b/nuclearvip
✅ Benefits : Lifetime Trading Fee Discount -50%
Feragatname
Bilgiler ve yayınlar, TradingView tarafından sağlanan veya onaylanan finansal, yatırım, alım satım veya diğer türden tavsiye veya öneriler anlamına gelmez ve teşkil etmez. Kullanım Koşulları bölümünde daha fazlasını okuyun.