Bullish Reversal in Play – ONDO/USDT Weekly Chart
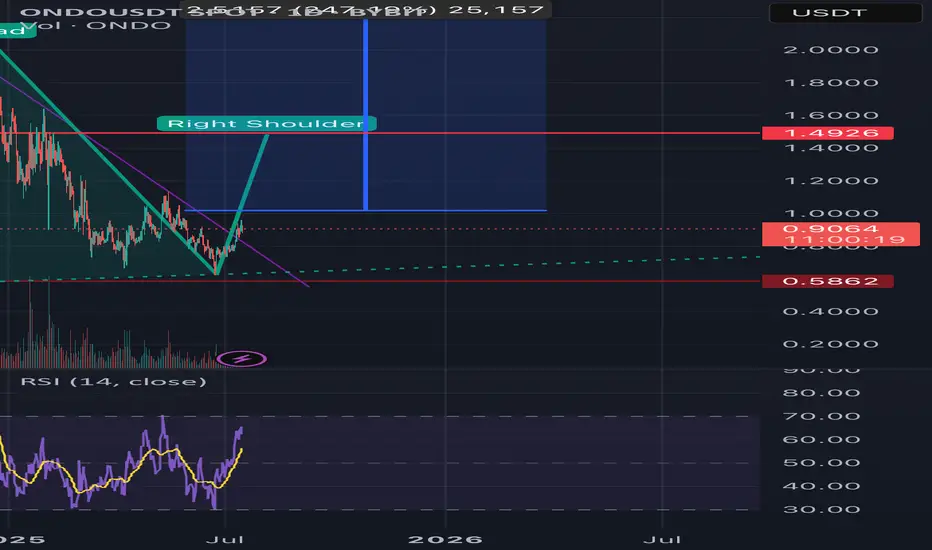
A clear Inverse Head and Shoulders pattern is forming on the weekly timeframe.
Price is currently breaking out of the neckline with strong momentum.
🔹 Left Shoulder: Formed with consistent volume support
🔹 Head: Deep correction followed by strong recovery
🔹 Right Shoulder: Higher low formation with bullish pressure
📈 Potential Target: $2.51 (+247%)
🛡️ Support Zone: ~$0.58
If this breakout confirms with weekly close above the neckline (~$0.90–$1.00),
we could be seeing the start of a major bull wave.
#ONDO #CryptoAnalysis #InverseHeadAndShoulders #Altseason #Breakout
Feragatname
Bilgiler ve yayınlar, TradingView tarafından sağlanan veya onaylanan finansal, yatırım, işlem veya diğer türden tavsiye veya tavsiyeler anlamına gelmez ve teşkil etmez. Kullanım Şartları'nda daha fazlasını okuyun.
Feragatname
Bilgiler ve yayınlar, TradingView tarafından sağlanan veya onaylanan finansal, yatırım, işlem veya diğer türden tavsiye veya tavsiyeler anlamına gelmez ve teşkil etmez. Kullanım Şartları'nda daha fazlasını okuyun.