Here is the weekly chart tradingview.com/x/oA07dYnC/. As you can see price stands at value, the wave does a great job.
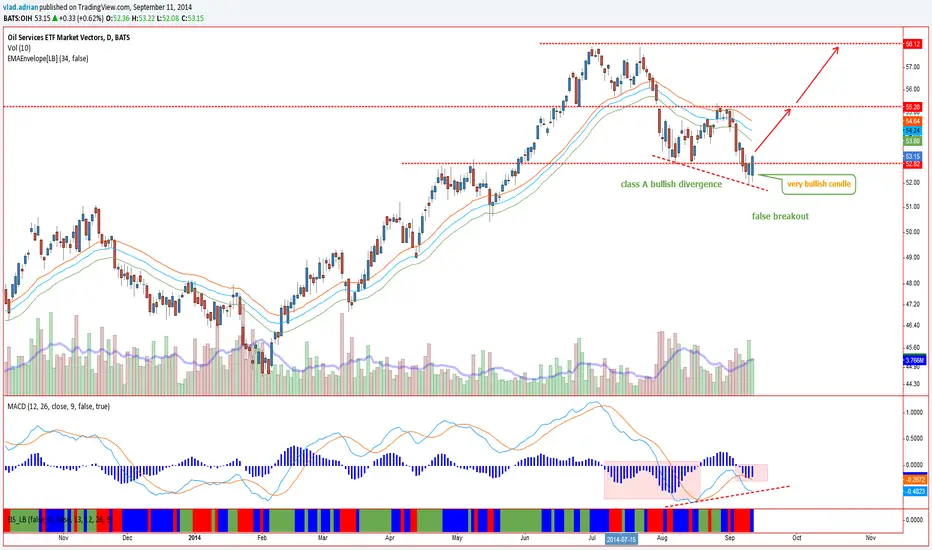
Going to the daily chart, we have a class A bullish divergence, and a bullish candle.
The price stands at a very important resistance area on the weekly chart, and it is very important how OIH will act at 55.20$. If there we will see strong rejection, I will close most of the position. If it does go over 55.20, expect it to go at least till 58$, at least!!
Long at 52.22, stop at 51.70$
Feragatname
Bilgiler ve yayınlar, TradingView tarafından sağlanan veya onaylanan finansal, yatırım, işlem veya diğer türden tavsiye veya tavsiyeler anlamına gelmez ve teşkil etmez. Kullanım Şartları'nda daha fazlasını okuyun.
Feragatname
Bilgiler ve yayınlar, TradingView tarafından sağlanan veya onaylanan finansal, yatırım, işlem veya diğer türden tavsiye veya tavsiyeler anlamına gelmez ve teşkil etmez. Kullanım Şartları'nda daha fazlasını okuyun.