NZD/USD4H Chart Analysis Bullish Reversal Setup from Demand Zone
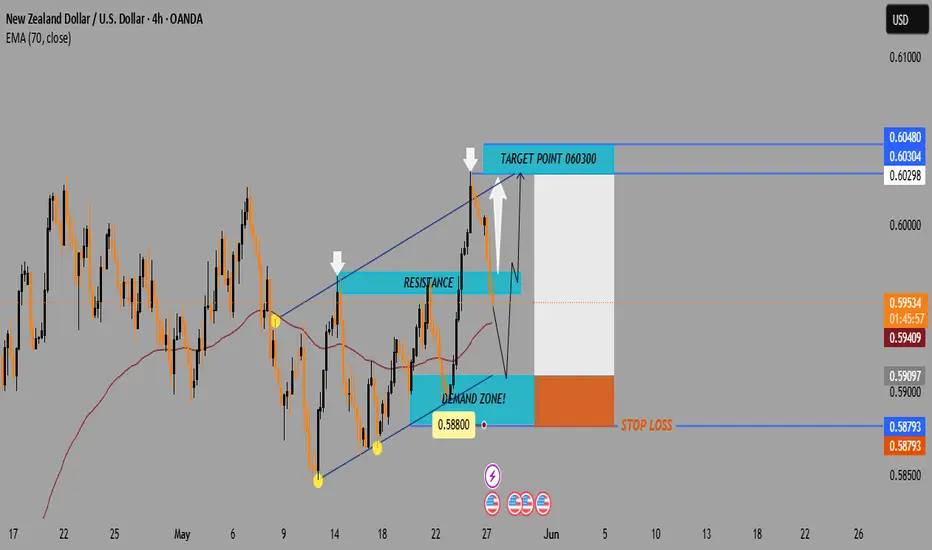
📈 Price: 0.59552
📊 EMA 70: 0.59410 (🟤 Brown Line)
Chart Zones & Key Levels
🔷 Resistance Zone:
🔼 Around 0.60298 – 0.60304
🔹 Price reacted strongly here (🔽 white arrows)
🔹 Acts as a ceiling for now
🟢 Demand Zone:
🔽 Around 0.58800
✅ Buyers stepped in here before
📉 If price drops again, might bounce from here
🟥 STOP LOSS:
❗ 0.58793
🔸 Protects from deeper losses if trend breaks down.
TRADE IDEA
1️⃣ Entry Idea: Wait for a pullback into the Demand Zone
📉⬇️
2️⃣ Bullish Reversal Expected:
⬆️ Bounce toward Target Zone
🎯 Target Point: 0.60300
🟦 Profit zone marked in blue
💸 Good Risk/Reward ratio.
Indicators & Pattern
📐 Wedge Pattern:
🔹 Bullish breakout potential
🔹 Currently respecting the channel
📉 EMA Crossover Area:
🔸 Could act as dynamic support/resistance
🟤 Price hovering around EMA (0.59410)
Summary:
✅ Buy Setup if price holds above 0.58800
🎯 Target: 0.60300
🛑 Stop Loss: 0.58793
⚠️ Watch the price reaction at the Demand Zone for confirmation!
join my tellegram channel
t.me/JaMesGoldFiGhteR786
join my refferal broker
xmglobal.com/referral?token=S4yGyqPUmU9uAANtb_YUoA
t.me/JaMesGoldFiGhteR786
join my refferal broker
xmglobal.com/referral?token=S4yGyqPUmU9uAANtb_YUoA
Feragatname
Bilgiler ve yayınlar, TradingView tarafından sağlanan veya onaylanan finansal, yatırım, işlem veya diğer türden tavsiye veya tavsiyeler anlamına gelmez ve teşkil etmez. Kullanım Şartları'nda daha fazlasını okuyun.