15-Min Chart Analysis (Intraday Trading Setup):
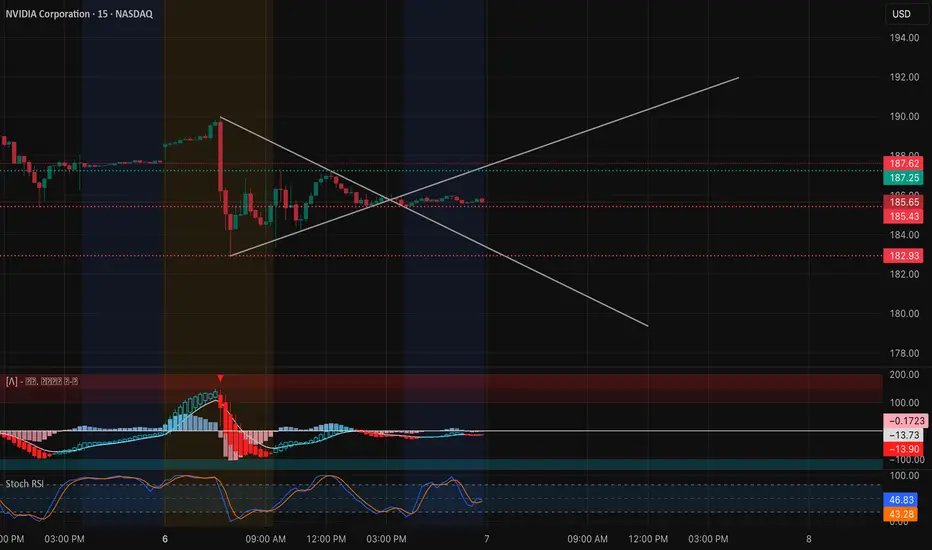
NVDA is forming a symmetrical triangle, compressing between $185–$187.5 after several sessions of choppy consolidation. This coiling pattern reflects equilibrium between buyers and sellers — a setup that typically precedes a strong breakout or breakdown.
Price is currently sitting at $185.65, hugging the triangle’s apex. The MACD is neutral, showing declining momentum but no bearish crossover confirmation yet. Meanwhile, Stoch RSI is resetting mid-range (46.83 / 43.28), suggesting the potential for a new move in either direction once momentum triggers.
Short-term levels to watch:
* Upside breakout zone: $187.25 → $187.62. A break and hold above this level could quickly push NVDA toward $190–$192.50.
* Downside support: $182.93 → $180.50. If price loses $182.93 with volume, it opens room for a retest of the $178 zone where prior liquidity pools exist.
Given the wedge compression, traders should stay patient — the move that follows could be sharp and decisive.
1-Hour GEX Confirmation (Options Sentiment Insight):

GEX levels on the 1-hour chart reinforce the technical setup perfectly:
* Highest positive NETGEX / CALL resistance stands at $192.50, forming a key magnet zone if NVDA breaks out.
* The $185 area aligns with a neutral gamma transition point — a battleground between dealers hedging both directions.
* Strong PUT walls are concentrated around $180–$172.50, creating a solid downside floor.
This gamma structure implies a coiled spring scenario — a decisive break above $187.5 could unleash gamma-driven upside momentum toward $190–$192, while losing $182.9 could accelerate a gamma unwind to $180.
My Thoughts: NVDA’s price action shows tightening volatility, a sign of energy building before expansion. With low IVR (14.8) and IVx (45.9) — volatility is compressed, making directional breakouts ideal for options traders.
I’m watching $187.50 as the key pivot. A breakout above it could trigger a short-term gamma squeeze toward $192.50, while a failure and rejection could lead to a fade toward $182–$180. This setup offers an attractive risk/reward in either direction — ideal for momentum traders.
Options Outlook (Oct 7–11):
* Bullish setup: Consider 187.5C or 190C (Oct 11 expiry) if price reclaims and holds above $187.5 with volume > average.
* Bearish setup: Consider 182.5P if NVDA fails at $187.5 and breaks below $183 with confirmed MACD divergence.
* Volatility note: With IVR at 14.8, option premiums are cheaper than usual — a good opportunity for directional swing entries.
Conclusion: NVDA is consolidating tightly at a critical crossroad. The symmetrical triangle plus neutral gamma landscape signals a breakout is near — watch $187.5 for confirmation. Above it, bulls can push toward $190–$192.5; below $183, bears gain control. Stay alert — the next move could define NVDA’s direction for the week.
Disclaimer: This analysis is for educational purposes only and does not constitute financial advice. Always do your own research and manage your risk before trading.
NVDA is forming a symmetrical triangle, compressing between $185–$187.5 after several sessions of choppy consolidation. This coiling pattern reflects equilibrium between buyers and sellers — a setup that typically precedes a strong breakout or breakdown.
Price is currently sitting at $185.65, hugging the triangle’s apex. The MACD is neutral, showing declining momentum but no bearish crossover confirmation yet. Meanwhile, Stoch RSI is resetting mid-range (46.83 / 43.28), suggesting the potential for a new move in either direction once momentum triggers.
Short-term levels to watch:
* Upside breakout zone: $187.25 → $187.62. A break and hold above this level could quickly push NVDA toward $190–$192.50.
* Downside support: $182.93 → $180.50. If price loses $182.93 with volume, it opens room for a retest of the $178 zone where prior liquidity pools exist.
Given the wedge compression, traders should stay patient — the move that follows could be sharp and decisive.
1-Hour GEX Confirmation (Options Sentiment Insight):
GEX levels on the 1-hour chart reinforce the technical setup perfectly:
* Highest positive NETGEX / CALL resistance stands at $192.50, forming a key magnet zone if NVDA breaks out.
* The $185 area aligns with a neutral gamma transition point — a battleground between dealers hedging both directions.
* Strong PUT walls are concentrated around $180–$172.50, creating a solid downside floor.
This gamma structure implies a coiled spring scenario — a decisive break above $187.5 could unleash gamma-driven upside momentum toward $190–$192, while losing $182.9 could accelerate a gamma unwind to $180.
My Thoughts: NVDA’s price action shows tightening volatility, a sign of energy building before expansion. With low IVR (14.8) and IVx (45.9) — volatility is compressed, making directional breakouts ideal for options traders.
I’m watching $187.50 as the key pivot. A breakout above it could trigger a short-term gamma squeeze toward $192.50, while a failure and rejection could lead to a fade toward $182–$180. This setup offers an attractive risk/reward in either direction — ideal for momentum traders.
Options Outlook (Oct 7–11):
* Bullish setup: Consider 187.5C or 190C (Oct 11 expiry) if price reclaims and holds above $187.5 with volume > average.
* Bearish setup: Consider 182.5P if NVDA fails at $187.5 and breaks below $183 with confirmed MACD divergence.
* Volatility note: With IVR at 14.8, option premiums are cheaper than usual — a good opportunity for directional swing entries.
Conclusion: NVDA is consolidating tightly at a critical crossroad. The symmetrical triangle plus neutral gamma landscape signals a breakout is near — watch $187.5 for confirmation. Above it, bulls can push toward $190–$192.5; below $183, bears gain control. Stay alert — the next move could define NVDA’s direction for the week.
Disclaimer: This analysis is for educational purposes only and does not constitute financial advice. Always do your own research and manage your risk before trading.
Feragatname
Bilgiler ve yayınlar, TradingView tarafından sağlanan veya onaylanan finansal, yatırım, işlem veya diğer türden tavsiye veya tavsiyeler anlamına gelmez ve teşkil etmez. Kullanım Şartları'nda daha fazlasını okuyun.
Feragatname
Bilgiler ve yayınlar, TradingView tarafından sağlanan veya onaylanan finansal, yatırım, işlem veya diğer türden tavsiye veya tavsiyeler anlamına gelmez ve teşkil etmez. Kullanım Şartları'nda daha fazlasını okuyun.