Nvidia  NVDA hit an all-time intraday high this past week after rebounding some 120% from its April lows. What does the AI-friendly chip giant's chart and fundamental analysis say could happen next?
Let's check things out:
Nvidia's Fundamental Analysis
We're still more than a month away from hearing from Nvidia about its Q3 quarterly results, which will likely come in late November.
But as of right now, the Street is looking for the high-end GPU designer to report $1.24 in adjusted earnings per share for the period on roughly $54.7 billion of revenue.
That would represent a 53.1% gain from the year-ago period's $0.81 in adjusted EPS, as well almost 56% growth from the $35.1 billion in revenues seen 12 months earlier.
That kind of sales growth would be more than impressive for almost any other firm, but would actually represent a deceleration from the growth pace NVDA has experienced over the past two years or so.
The advent of big capex up-spend on artificial-intelligence-focused infrastructure meant Nvidia boasted annual sales growth well into three-figure percentages during much of 2023 and into 2024.
But the "law of large numbers" eventually kicks in for everyone, even Nvidia -- and that's really not a bad thing at all. After all, NVDA's stock currently trades at about 30 times forward-looking earnings and 53 times trailing earnings.
Expensive? Maybe, but a growth rate at this kind of scale is hard to put a price on. Less than 1% of Nvidia's entire float is held in short positions, so we know there aren't a lot of NVDA out there.
In fact, 33 of the 38 sell-side analysts that I know of who cover NVDA have revised their Q3 earnings estimates higher since the quarter began, while just two have lowered their forecasts. (Three have left their estimates unchanged.)
And in full disclosure, I'm personally long this name and have been for a very long time.
Nvidia's Technical Analysis
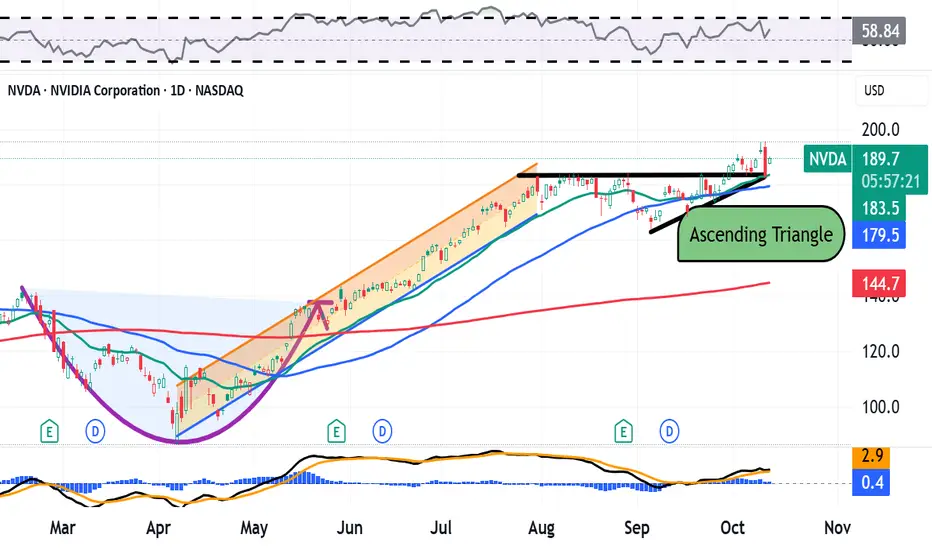
Now let's check out NVDA's chart going back some eight months and running through Wednesday afternoon:

Readers will see that Nvidia bottomed out at $86.62 intraday on April 7, forming a bullish "cup-with-handle" pattern in the process (marked with a curving purple in at the chart's left).
The stock then rallied from that early April low into late July, which I've illustrated with a Raff Regression model (the orange-shaded area above).
However, NVDA next hit stiff resistance from late July through late September, bumping its head up against the Raff Regression's ceiling many times before finally cracking through on Sept. 30.
This resistance formed the upper trendline of what's known as an "ascending-triangle" pattern of bullish continuance, marked with thick black lines at the chart's right.
The top black line now serves as Nvidia's pivot at the $184 level. We can see that since cracking this line in recent days, the stock has tested it from above and found support. (NVDA was trading at $189.85 Monday morning as I wrote this after hitting a $195.62 all-time intraday high on Friday.)
Meanwhile, Nvidia's secondary indicators are postured quite bullishly.
Its Relative Strength Index (the gray line marked "RSI" at the chart's top) is improving and flashing a better-than-neutral signal, but isn't yet technically overbought.
Similarly, all three components of Nvidia's daily Moving Average Convergence Divergence indications (or "MACD," marked with black and gold lines and blue bars at the chart's bottom) are in good shape.
The histogram of the 9-day EMA (blue field) is above the zero-bound, as are the 12-day Exponential Moving Average (or "EMA," denoted with a black line) and 26-day EMA (the gold line). The best part for the bulls is that the 12-day line is running above the 26-day line and both lines are still rising.
An Options Option
A bullish trader might get involved with Nvidia by initiating a "buy-write" strategy.
This involves purchasing a stock and simultaneously "writing" (i.e. selling) a covered call against that equity position to reduce the investor's net basis. Here's an example:
-- Buy 100 shares of NVDA at or close to $188.
-- Sell (write) one Nov. 21 $210 call for about $4.25. This call will likely expire after Nvidia's 3Q earnings come out.
Net basis: $183.75.
In the example above, selling the covered call will significantly lower the equity position's net basis.
Should the shares be called away in November, the trader would still realize a 14.3% profit. That's fine, but this trade is really about getting long NVDA while finding ways to reduce net basis.
The trader in the example above could theoretically keep writing covered calls against the stock for as long as the equity position exists, further and further reducing net basis.
(Moomoo Technologies Inc. Markets Commentator Stephen "Sarge" Guilfoyle was long NVDA at the time of writing this column.)
This article discusses technical analysis, other approaches, including fundamental analysis, may offer very different views. The examples provided are for illustrative purposes only and are not intended to be reflective of the results you can expect to achieve. Specific security charts used are for illustrative purposes only and are not a recommendation, offer to sell, or a solicitation of an offer to buy any security. Past investment performance does not indicate or guarantee future success. Returns will vary, and all investments carry risks, including loss of principal. This content is also not a research report and is not intended to serve as the basis for any investment decision. The information contained in this article does not purport to be a complete description of the securities, markets, or developments referred to in this material. Moomoo and its affiliates make no representation or warranty as to the article's adequacy, completeness, accuracy or timeliness for any particular purpose of the above content. Furthermore, there is no guarantee that any statements, estimates, price targets, opinions or forecasts provided herein will prove to be correct.
Options trading is risky and not appropriate for everyone. Read the Options Disclosure Document (https://j.moomoo.com/017y9J) before trading. Options are complex and you may quickly lose the entire investment. Supporting docs for any claims will be furnished upon request.
Options trading subject to eligibility requirements. Strategies available will depend on options level approved.
Maximum potential loss and profit for options are calculated based on the single leg or an entire multi-leg trade remaining intact until expiration with no option contracts being exercised or assigned. These figures do not account for a portion of a multi-leg strategy being changed or removed or the trader assuming a short or long position in the underlying stock at or before expiration. Therefore, it is possible to lose more than the theoretical max loss of a strategy.
Moomoo is a financial information and trading app offered by Moomoo Technologies Inc. In the U.S., investment products and services on Moomoo are offered by Moomoo Financial Inc., Member FINRA/SIPC.
TradingView is an independent third party not affiliated with Moomoo Financial Inc., Moomoo Technologies Inc., or its affiliates. Moomoo Financial Inc. and its affiliates do not endorse, represent or warrant the completeness and accuracy of the data and information available on the TradingView platform and are not responsible for any services provided by the third-party platform.
Let's check things out:
Nvidia's Fundamental Analysis
We're still more than a month away from hearing from Nvidia about its Q3 quarterly results, which will likely come in late November.
But as of right now, the Street is looking for the high-end GPU designer to report $1.24 in adjusted earnings per share for the period on roughly $54.7 billion of revenue.
That would represent a 53.1% gain from the year-ago period's $0.81 in adjusted EPS, as well almost 56% growth from the $35.1 billion in revenues seen 12 months earlier.
That kind of sales growth would be more than impressive for almost any other firm, but would actually represent a deceleration from the growth pace NVDA has experienced over the past two years or so.
The advent of big capex up-spend on artificial-intelligence-focused infrastructure meant Nvidia boasted annual sales growth well into three-figure percentages during much of 2023 and into 2024.
But the "law of large numbers" eventually kicks in for everyone, even Nvidia -- and that's really not a bad thing at all. After all, NVDA's stock currently trades at about 30 times forward-looking earnings and 53 times trailing earnings.
Expensive? Maybe, but a growth rate at this kind of scale is hard to put a price on. Less than 1% of Nvidia's entire float is held in short positions, so we know there aren't a lot of NVDA out there.
In fact, 33 of the 38 sell-side analysts that I know of who cover NVDA have revised their Q3 earnings estimates higher since the quarter began, while just two have lowered their forecasts. (Three have left their estimates unchanged.)
And in full disclosure, I'm personally long this name and have been for a very long time.
Nvidia's Technical Analysis
Now let's check out NVDA's chart going back some eight months and running through Wednesday afternoon:
Readers will see that Nvidia bottomed out at $86.62 intraday on April 7, forming a bullish "cup-with-handle" pattern in the process (marked with a curving purple in at the chart's left).
The stock then rallied from that early April low into late July, which I've illustrated with a Raff Regression model (the orange-shaded area above).
However, NVDA next hit stiff resistance from late July through late September, bumping its head up against the Raff Regression's ceiling many times before finally cracking through on Sept. 30.
This resistance formed the upper trendline of what's known as an "ascending-triangle" pattern of bullish continuance, marked with thick black lines at the chart's right.
The top black line now serves as Nvidia's pivot at the $184 level. We can see that since cracking this line in recent days, the stock has tested it from above and found support. (NVDA was trading at $189.85 Monday morning as I wrote this after hitting a $195.62 all-time intraday high on Friday.)
Meanwhile, Nvidia's secondary indicators are postured quite bullishly.
Its Relative Strength Index (the gray line marked "RSI" at the chart's top) is improving and flashing a better-than-neutral signal, but isn't yet technically overbought.
Similarly, all three components of Nvidia's daily Moving Average Convergence Divergence indications (or "MACD," marked with black and gold lines and blue bars at the chart's bottom) are in good shape.
The histogram of the 9-day EMA (blue field) is above the zero-bound, as are the 12-day Exponential Moving Average (or "EMA," denoted with a black line) and 26-day EMA (the gold line). The best part for the bulls is that the 12-day line is running above the 26-day line and both lines are still rising.
An Options Option
A bullish trader might get involved with Nvidia by initiating a "buy-write" strategy.
This involves purchasing a stock and simultaneously "writing" (i.e. selling) a covered call against that equity position to reduce the investor's net basis. Here's an example:
-- Buy 100 shares of NVDA at or close to $188.
-- Sell (write) one Nov. 21 $210 call for about $4.25. This call will likely expire after Nvidia's 3Q earnings come out.
Net basis: $183.75.
In the example above, selling the covered call will significantly lower the equity position's net basis.
Should the shares be called away in November, the trader would still realize a 14.3% profit. That's fine, but this trade is really about getting long NVDA while finding ways to reduce net basis.
The trader in the example above could theoretically keep writing covered calls against the stock for as long as the equity position exists, further and further reducing net basis.
(Moomoo Technologies Inc. Markets Commentator Stephen "Sarge" Guilfoyle was long NVDA at the time of writing this column.)
This article discusses technical analysis, other approaches, including fundamental analysis, may offer very different views. The examples provided are for illustrative purposes only and are not intended to be reflective of the results you can expect to achieve. Specific security charts used are for illustrative purposes only and are not a recommendation, offer to sell, or a solicitation of an offer to buy any security. Past investment performance does not indicate or guarantee future success. Returns will vary, and all investments carry risks, including loss of principal. This content is also not a research report and is not intended to serve as the basis for any investment decision. The information contained in this article does not purport to be a complete description of the securities, markets, or developments referred to in this material. Moomoo and its affiliates make no representation or warranty as to the article's adequacy, completeness, accuracy or timeliness for any particular purpose of the above content. Furthermore, there is no guarantee that any statements, estimates, price targets, opinions or forecasts provided herein will prove to be correct.
Options trading is risky and not appropriate for everyone. Read the Options Disclosure Document (https://j.moomoo.com/017y9J) before trading. Options are complex and you may quickly lose the entire investment. Supporting docs for any claims will be furnished upon request.
Options trading subject to eligibility requirements. Strategies available will depend on options level approved.
Maximum potential loss and profit for options are calculated based on the single leg or an entire multi-leg trade remaining intact until expiration with no option contracts being exercised or assigned. These figures do not account for a portion of a multi-leg strategy being changed or removed or the trader assuming a short or long position in the underlying stock at or before expiration. Therefore, it is possible to lose more than the theoretical max loss of a strategy.
Moomoo is a financial information and trading app offered by Moomoo Technologies Inc. In the U.S., investment products and services on Moomoo are offered by Moomoo Financial Inc., Member FINRA/SIPC.
TradingView is an independent third party not affiliated with Moomoo Financial Inc., Moomoo Technologies Inc., or its affiliates. Moomoo Financial Inc. and its affiliates do not endorse, represent or warrant the completeness and accuracy of the data and information available on the TradingView platform and are not responsible for any services provided by the third-party platform.
Feragatname
Bilgiler ve yayınlar, TradingView tarafından sağlanan veya onaylanan finansal, yatırım, alım satım veya diğer türden tavsiye veya öneriler anlamına gelmez ve teşkil etmez. Kullanım Koşulları bölümünde daha fazlasını okuyun.
Feragatname
Bilgiler ve yayınlar, TradingView tarafından sağlanan veya onaylanan finansal, yatırım, alım satım veya diğer türden tavsiye veya öneriler anlamına gelmez ve teşkil etmez. Kullanım Koşulları bölümünde daha fazlasını okuyun.