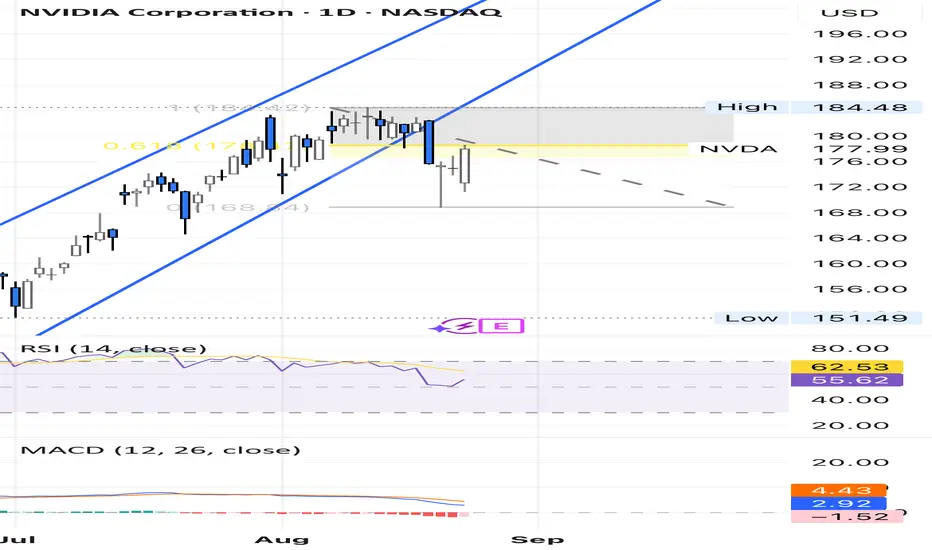
An analysis of Nvidia's price action shows it trading within a four-month-long ascending channel. The price has recently broken below the channel's support line and has since retraced to a key Fibonacci level. This price action, combined with bearish indicators from the MACD and RSI on the daily and weekly charts, presents a technical case for a potential trend reversal.
Feragatname
Bilgiler ve yayınlar, TradingView tarafından sağlanan veya onaylanan finansal, yatırım, alım satım veya diğer türden tavsiye veya öneriler anlamına gelmez ve teşkil etmez. Kullanım Koşulları bölümünde daha fazlasını okuyun.
Feragatname
Bilgiler ve yayınlar, TradingView tarafından sağlanan veya onaylanan finansal, yatırım, alım satım veya diğer türden tavsiye veya öneriler anlamına gelmez ve teşkil etmez. Kullanım Koşulları bölümünde daha fazlasını okuyun.