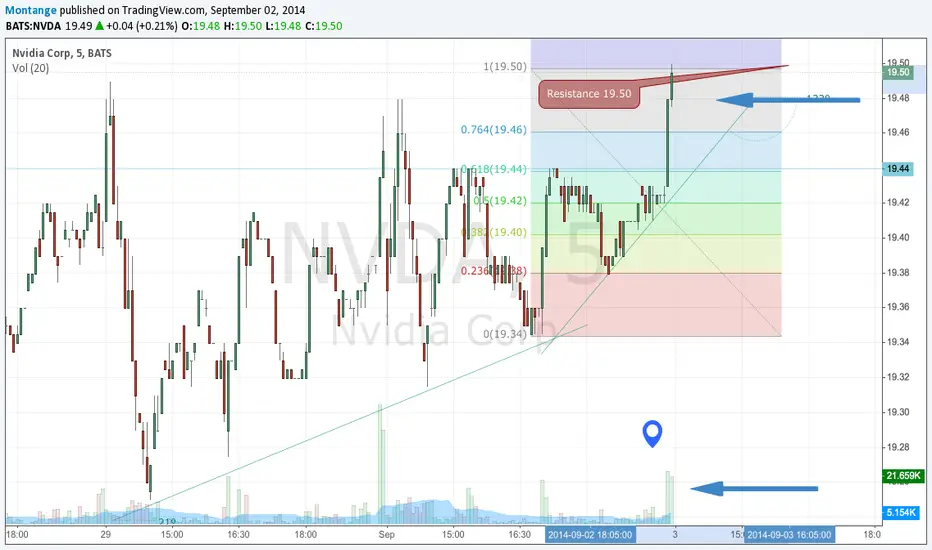
NVDA, has a excellent bullish pattern. But, be aware this stock is one to disappoint. The slight decrease in volume suggests lower bullish momentum for 9-03-2014. Fibonacci is showing resistance at the close of 19.50; this suggests that it will take a increase in volume to beat the mark. If your period of trading is on the 5-day chart. Long-term we are bullish giving a target price above 20.30 per share. Yield is low.
Feragatname
Bilgiler ve yayınlar, TradingView tarafından sağlanan veya onaylanan finansal, yatırım, işlem veya diğer türden tavsiye veya tavsiyeler anlamına gelmez ve teşkil etmez. Kullanım Şartları'nda daha fazlasını okuyun.
Feragatname
Bilgiler ve yayınlar, TradingView tarafından sağlanan veya onaylanan finansal, yatırım, işlem veya diğer türden tavsiye veya tavsiyeler anlamına gelmez ve teşkil etmez. Kullanım Şartları'nda daha fazlasını okuyun.