Annotations Patterns:
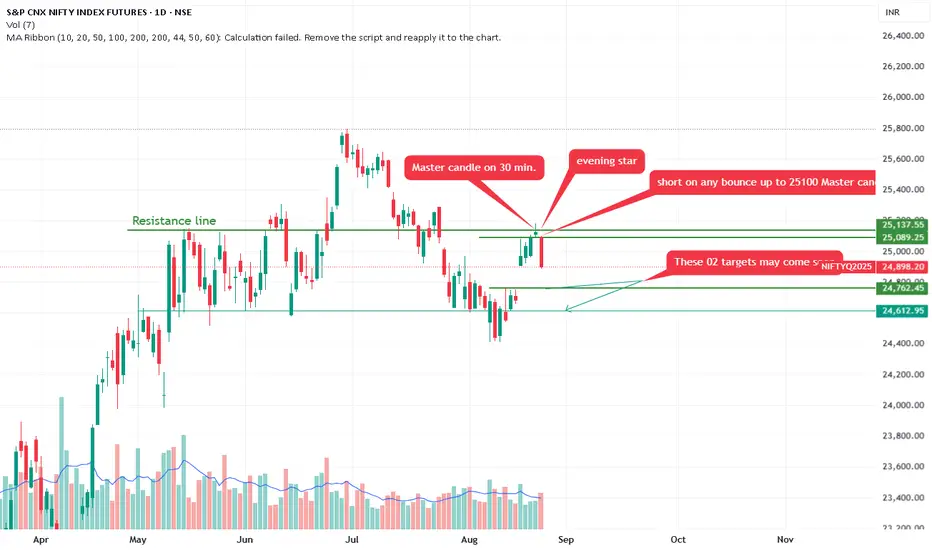
Master Candle on 30 min. Evening Star: Points to the recent high. A "master candle" refers to a large-range candle (here, likely on a 30-minute timeframe) that encompasses subsequent smaller candles, Combined with an "evening star" pattern—a three-candle bearish reversal (large green candle, small-bodied doji/star, followed by a large red candle closing below the first's midpoint)—this suggests a topping formation and potential for further downside.
Short on Any Bounce Up to 25,000-25,100 Master Candle Low.
Recommends selling (shorting) if price rebounds to 25,000-25,100 (labeled as the master candle's low, acting as resistance on pullback).
These 02 Targets May Come Soon: Arrows to lower levels (~24,793 and possibly 24,613), implying quick downside targets.
A downward-sloping green trendline projects further decline.
Overall Trend: The chart depicts a bull market correction or potential reversal. After months of gains, momentum has shifted bearish, with price breaking below key supports (e.g., the green line at 25,137). Higher volume on declines reinforces this.
The chart's creator appears to have a bearish bias, focusing on reversal patterns and downside projections.
İşlem aktif
Nifty crashhhh.........Target-1 24,777 done.
Feragatname
Bilgiler ve yayınlar, TradingView tarafından sağlanan veya onaylanan finansal, yatırım, işlem veya diğer türden tavsiye veya tavsiyeler anlamına gelmez ve teşkil etmez. Kullanım Şartları'nda daha fazlasını okuyun.
Feragatname
Bilgiler ve yayınlar, TradingView tarafından sağlanan veya onaylanan finansal, yatırım, işlem veya diğer türden tavsiye veya tavsiyeler anlamına gelmez ve teşkil etmez. Kullanım Şartları'nda daha fazlasını okuyun.