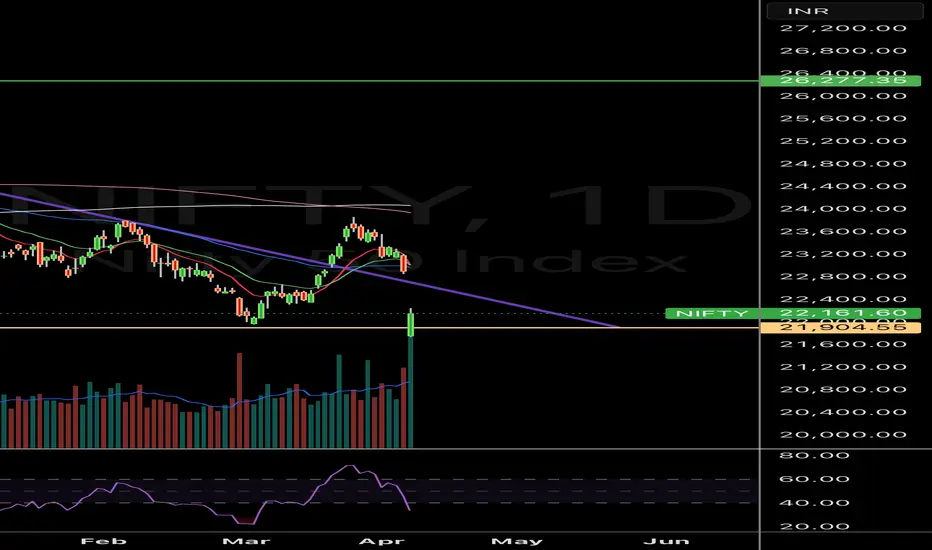
Yes, Nifty closed at 22,161 (-742 pts) after a gap-down, but here’s the bullish lens:
• Price still above 21,900 – a major support & previous breakout zone
• Volume spike could indicate capitulation selling – smart money may be absorbing
• RSI nearing oversold – watch for a bounce
• Bullish structure intact as long as 21,900 holds
If buyers step in here, we may see a V-shape recovery.
This zone is where trendlines break… or bounce.
#Nifty #Nifty50 #TechnicalAnalysis #PriceAction #StockMarket #Bullish #NSE
Feragatname
Bilgiler ve yayınlar, TradingView tarafından sağlanan veya onaylanan finansal, yatırım, işlem veya diğer türden tavsiye veya tavsiyeler anlamına gelmez ve teşkil etmez. Kullanım Şartları'nda daha fazlasını okuyun.
Feragatname
Bilgiler ve yayınlar, TradingView tarafından sağlanan veya onaylanan finansal, yatırım, işlem veya diğer türden tavsiye veya tavsiyeler anlamına gelmez ve teşkil etmez. Kullanım Şartları'nda daha fazlasını okuyun.