The market's performance on Friday, September 26, the Nifty has continued its sharp decline, breaking multiple support levels. The market is now in a strong bearish trend, with a clear downward channel across all timeframes.
Detailed Market Structure Breakdown
4-Hour Chart (Macro Trend)
Structure: The Nifty is in a deep corrective phase, having broken the critical 25,050 - 25,100 zone and continued its fall. The price closed right at the strong macro demand zone of 24,650 - 24,700, which is a prior accumulation area. This area is the key "line in the sand" for the medium-term bullish structure that started in early September.
Key Levels:
Major Supply (Resistance): 24,800 - 24,850. This area is now a strong overhead resistance, aligning with the broken lower channel line from the previous week.
Major Demand (Support): 24,600 - 24,650. This is the immediate and most critical support zone. A sustained breakdown below 24,600 would suggest the correction is far from over, with the next target at 24,400.
Outlook: The trend is strongly bearish, but the index is sitting on a major support level. A bounce is highly probable from this zone, but the overall bias remains "sell on rise."
1-Hour Chart (Intermediate View)
Structure: The 1H chart is strongly bearish, trading in a well-defined descending channel. The market is making lower lows and lower highs, and the latest move penetrated the strong 24,650 support zone before a slight bounce.
Key Levels:
Immediate Resistance: The upper trendline of the descending channel, currently near 24,780.
Immediate Support: 24,600. This is the level that bulls must defend at the open.
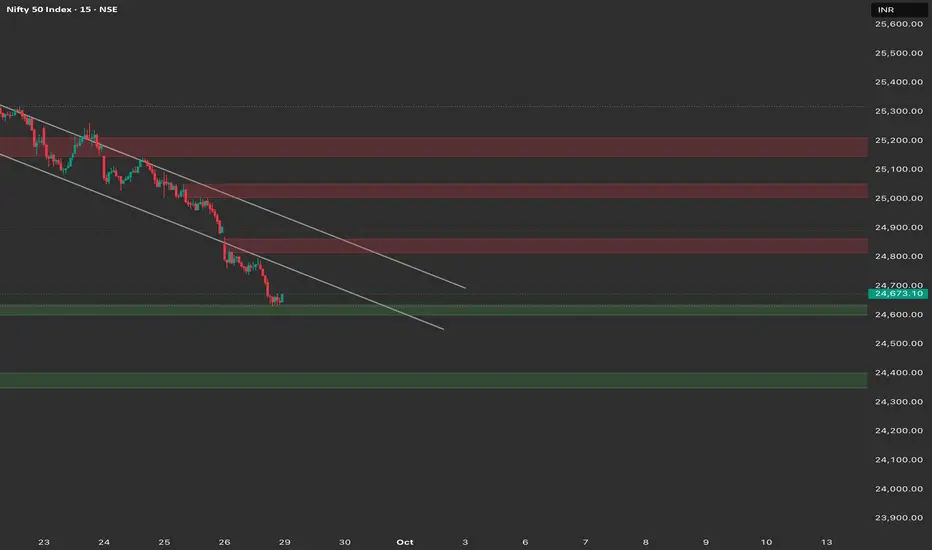
15-Minute Chart (Intraday View)
Structure: The 15M chart confirms the steep bearish momentum. The index is trading at the bottom of its descending channel. Any opening below 24,650 will invite further selling.
Key Levels:
Intraday Supply: 24,750 - 24,800. This is the high of the recent small consolidation and the immediate resistance.
Intraday Demand: 24,600. The crucial level to watch for Monday.
Outlook: The primary strategy is to sell into strength or on a breakdown, as the overall trend is down.
Trade Plan (Monday, 29th September)
Market Outlook: The Nifty is bearish, but located at a major support zone. The strategy is centered on whether 24,600 holds.
Bearish Scenario (Primary Plan)
Justification: The breakdown below the macro support at 24,600 would confirm the continuation of the strong bearish trend toward the next accumulation zone.
Entry: Short entry on a decisive break and 15-minute candle close below 24,600.
Stop Loss (SL): Place a stop loss above 24,700.
Targets:
T1: 24,500 (Minor psychological support).
T2: 24,400 (Next major support zone).
Bullish Scenario (Counter-Trend/Reversal Plan)
Justification: This is a high-risk, counter-trend plan. It relies on the strong demand zone at 24,600 holding firm.
Trigger: A reversal from the 24,600 - 24,650 zone (e.g., a hammer or bullish engulfing candle) or a sustained move and close above 24,800.
Entry: Long entry on a confirmed bounce from 24,600 - 24,650 with a bullish pattern, or on a break above 24,800.
Stop Loss (SL): Below 24,580 (for a bounce trade) or 24,700 (for a breakout trade).
Targets:
T1: 24,850 (Upper channel resistance).
T2: 25,000 (Psychological resistance).
Key Levels for Observation:
Immediate Decision Point: The 24,600 - 24,700 zone.
Bearish Confirmation: A break and sustained move below 24,600.
Bullish Confirmation: A recapture of the 24,800 level.
Line in the Sand: 24,600. The overall market structure will weaken significantly below this level.
Detailed Market Structure Breakdown
4-Hour Chart (Macro Trend)
Structure: The Nifty is in a deep corrective phase, having broken the critical 25,050 - 25,100 zone and continued its fall. The price closed right at the strong macro demand zone of 24,650 - 24,700, which is a prior accumulation area. This area is the key "line in the sand" for the medium-term bullish structure that started in early September.
Key Levels:
Major Supply (Resistance): 24,800 - 24,850. This area is now a strong overhead resistance, aligning with the broken lower channel line from the previous week.
Major Demand (Support): 24,600 - 24,650. This is the immediate and most critical support zone. A sustained breakdown below 24,600 would suggest the correction is far from over, with the next target at 24,400.
Outlook: The trend is strongly bearish, but the index is sitting on a major support level. A bounce is highly probable from this zone, but the overall bias remains "sell on rise."
1-Hour Chart (Intermediate View)
Structure: The 1H chart is strongly bearish, trading in a well-defined descending channel. The market is making lower lows and lower highs, and the latest move penetrated the strong 24,650 support zone before a slight bounce.
Key Levels:
Immediate Resistance: The upper trendline of the descending channel, currently near 24,780.
Immediate Support: 24,600. This is the level that bulls must defend at the open.
15-Minute Chart (Intraday View)
Structure: The 15M chart confirms the steep bearish momentum. The index is trading at the bottom of its descending channel. Any opening below 24,650 will invite further selling.
Key Levels:
Intraday Supply: 24,750 - 24,800. This is the high of the recent small consolidation and the immediate resistance.
Intraday Demand: 24,600. The crucial level to watch for Monday.
Outlook: The primary strategy is to sell into strength or on a breakdown, as the overall trend is down.
Trade Plan (Monday, 29th September)
Market Outlook: The Nifty is bearish, but located at a major support zone. The strategy is centered on whether 24,600 holds.
Bearish Scenario (Primary Plan)
Justification: The breakdown below the macro support at 24,600 would confirm the continuation of the strong bearish trend toward the next accumulation zone.
Entry: Short entry on a decisive break and 15-minute candle close below 24,600.
Stop Loss (SL): Place a stop loss above 24,700.
Targets:
T1: 24,500 (Minor psychological support).
T2: 24,400 (Next major support zone).
Bullish Scenario (Counter-Trend/Reversal Plan)
Justification: This is a high-risk, counter-trend plan. It relies on the strong demand zone at 24,600 holding firm.
Trigger: A reversal from the 24,600 - 24,650 zone (e.g., a hammer or bullish engulfing candle) or a sustained move and close above 24,800.
Entry: Long entry on a confirmed bounce from 24,600 - 24,650 with a bullish pattern, or on a break above 24,800.
Stop Loss (SL): Below 24,580 (for a bounce trade) or 24,700 (for a breakout trade).
Targets:
T1: 24,850 (Upper channel resistance).
T2: 25,000 (Psychological resistance).
Key Levels for Observation:
Immediate Decision Point: The 24,600 - 24,700 zone.
Bearish Confirmation: A break and sustained move below 24,600.
Bullish Confirmation: A recapture of the 24,800 level.
Line in the Sand: 24,600. The overall market structure will weaken significantly below this level.
Feragatname
Bilgiler ve yayınlar, TradingView tarafından sağlanan veya onaylanan finansal, yatırım, işlem veya diğer türden tavsiye veya tavsiyeler anlamına gelmez ve teşkil etmez. Kullanım Şartları'nda daha fazlasını okuyun.
Feragatname
Bilgiler ve yayınlar, TradingView tarafından sağlanan veya onaylanan finansal, yatırım, işlem veya diğer türden tavsiye veya tavsiyeler anlamına gelmez ve teşkil etmez. Kullanım Şartları'nda daha fazlasını okuyun.