VWAP Zone:
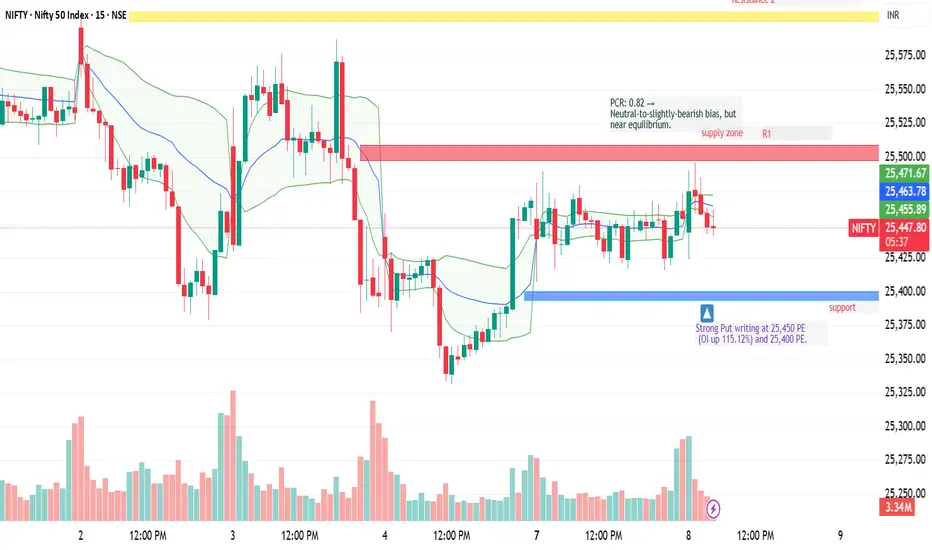
The VWAP lies at 25,456–25,464, acting as a dynamic resistance zone — price has failed to sustain above this level multiple times.
Price Pattern:
Multiple small-bodied candles with wicks indicate indecision and low momentum.
This suggests volatility compression — a breakout may follow.
Bollinger Bands:
Price hugging the middle band, with slightly narrowing bands — signals range contraction.
Feragatname
Bilgiler ve yayınlar, TradingView tarafından sağlanan veya onaylanan finansal, yatırım, işlem veya diğer türden tavsiye veya tavsiyeler anlamına gelmez ve teşkil etmez. Kullanım Şartları'nda daha fazlasını okuyun.
Feragatname
Bilgiler ve yayınlar, TradingView tarafından sağlanan veya onaylanan finansal, yatırım, işlem veya diğer türden tavsiye veya tavsiyeler anlamına gelmez ve teşkil etmez. Kullanım Şartları'nda daha fazlasını okuyun.