Use this as a guide to develop your view:
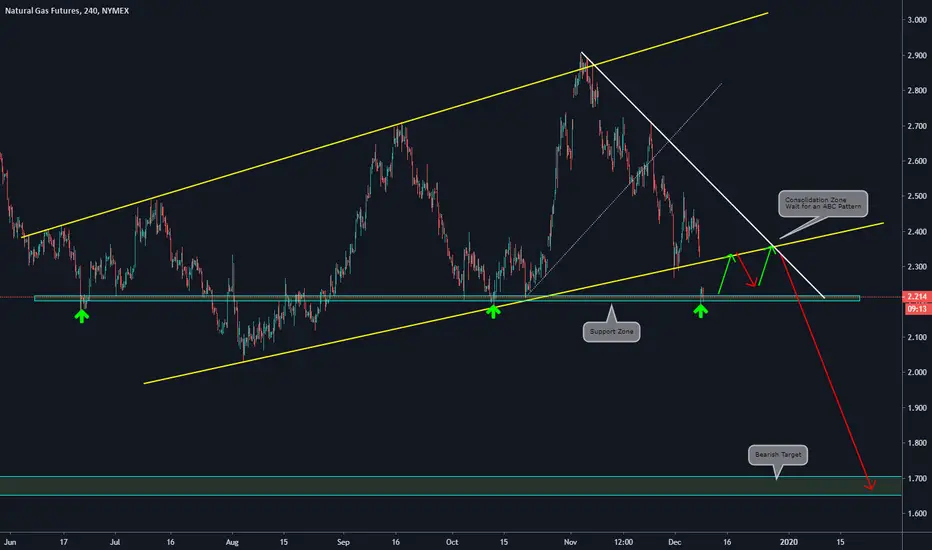
Main items we can observe on the 4HS chart:
a)Price has broken the primary structure (yellow lines) with a bearish movement
b)The price found support on the 2.20 level
c)We Expect an ABC formation with a pullback to the broken structure
d)If the ABC formation happens, we forecast a continuation of the bearish movement towards the next support zone at the 1.7 level
Daily Vision:

Weekly Vision:

Main items we can observe on the 4HS chart:
a)Price has broken the primary structure (yellow lines) with a bearish movement
b)The price found support on the 2.20 level
c)We Expect an ABC formation with a pullback to the broken structure
d)If the ABC formation happens, we forecast a continuation of the bearish movement towards the next support zone at the 1.7 level
Daily Vision:
Weekly Vision:
Feragatname
Bilgiler ve yayınlar, TradingView tarafından sağlanan veya onaylanan finansal, yatırım, alım satım veya diğer türden tavsiye veya öneriler anlamına gelmez ve teşkil etmez. Kullanım Koşulları bölümünde daha fazlasını okuyun.
Feragatname
Bilgiler ve yayınlar, TradingView tarafından sağlanan veya onaylanan finansal, yatırım, alım satım veya diğer türden tavsiye veya öneriler anlamına gelmez ve teşkil etmez. Kullanım Koşulları bölümünde daha fazlasını okuyun.