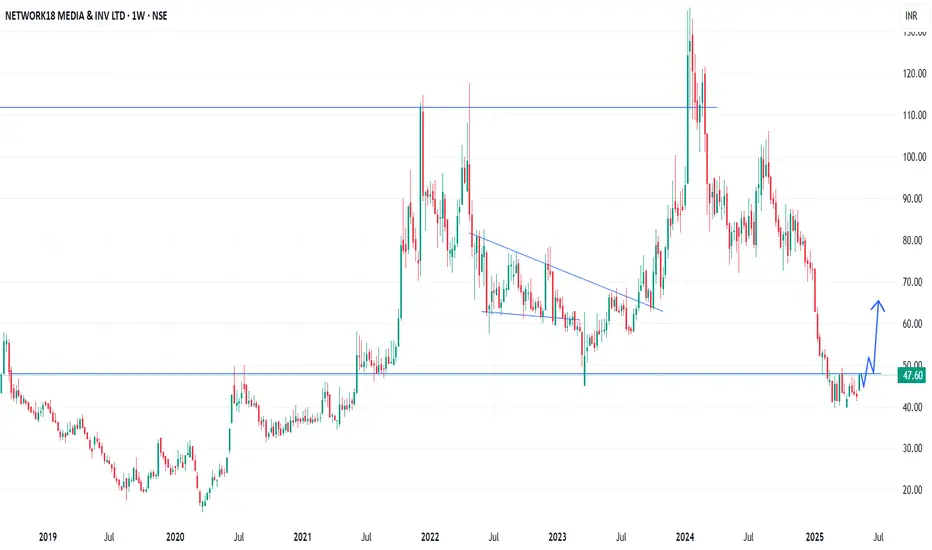
In the Weekly Chart of NETWORK18 ,
we can see that; it is trying to recover from very bottom with W Shape recovery.
Let it create one or two Halt candles to get more strong momentum.
Expected momentum is shown in chart.
we can see that; it is trying to recover from very bottom with W Shape recovery.
Let it create one or two Halt candles to get more strong momentum.
Expected momentum is shown in chart.
Feragatname
Bilgiler ve yayınlar, TradingView tarafından sağlanan veya onaylanan finansal, yatırım, alım satım veya diğer türden tavsiye veya öneriler anlamına gelmez ve teşkil etmez. Kullanım Koşulları bölümünde daha fazlasını okuyun.
Feragatname
Bilgiler ve yayınlar, TradingView tarafından sağlanan veya onaylanan finansal, yatırım, alım satım veya diğer türden tavsiye veya öneriler anlamına gelmez ve teşkil etmez. Kullanım Koşulları bölümünde daha fazlasını okuyun.