NETWEB is trading at ₹4,216.00, reflecting a 3.79% increase from the previous close.
📈 1-Hour Technical Analysis (as of 10:43 AM IST)
Based on intraday data, here are the key technical indicators for NETWEB on the 1-hour timeframe:
Relative Strength Index (RSI): 81.37 — indicates the stock is in the overbought zone, suggesting potential for a short-term pullback.
Moving Average Convergence Divergence (MACD): 395.90 — confirms a strong bullish momentum.
Average Directional Index (ADX): 60.55 — suggests a strong trend in the market.
Stochastic Oscillator: 89.93 — indicates the stock is in the overbought zone.
Super Trend: ₹3,386.37 — supports the current upward movement .
Williams %R: -4.50 — suggests the stock is in the overbought zone.
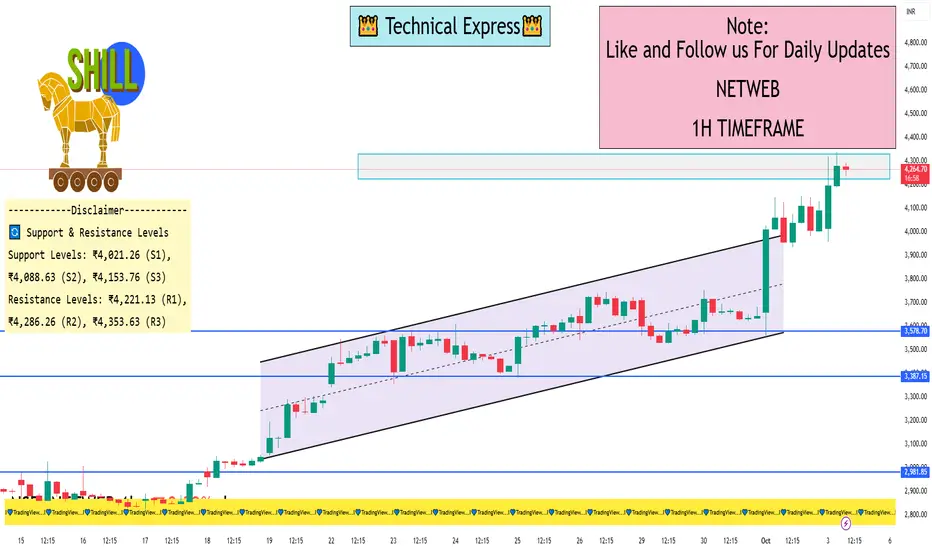
🔄 Support & Resistance Levels
According to pivot point analysis, the key support and resistance levels for NETWEB are:
Support Levels: ₹4,021.26 (S1), ₹4,088.63 (S2), ₹4,153.76 (S3).
Resistance Levels: ₹4,221.13 (R1), ₹4,286.26 (R2), ₹4,353.63 (R3).
The current price of ₹4,216.00 is near the R1 resistance level, indicating potential for a breakout if the price surpasses this level.
📊 Trend Analysis
The stock is exhibiting strong bullish indicators across multiple timeframes, including the 1-hour chart. The RSI, MACD, and ADX all suggest a continuation of the upward trend. However, the overbought conditions indicated by the RSI, Stochastic Oscillator, and Williams %R suggest that traders should be cautious of potential short-term pullbacks.
📈 1-Hour Technical Analysis (as of 10:43 AM IST)
Based on intraday data, here are the key technical indicators for NETWEB on the 1-hour timeframe:
Relative Strength Index (RSI): 81.37 — indicates the stock is in the overbought zone, suggesting potential for a short-term pullback.
Moving Average Convergence Divergence (MACD): 395.90 — confirms a strong bullish momentum.
Average Directional Index (ADX): 60.55 — suggests a strong trend in the market.
Stochastic Oscillator: 89.93 — indicates the stock is in the overbought zone.
Super Trend: ₹3,386.37 — supports the current upward movement .
Williams %R: -4.50 — suggests the stock is in the overbought zone.
🔄 Support & Resistance Levels
According to pivot point analysis, the key support and resistance levels for NETWEB are:
Support Levels: ₹4,021.26 (S1), ₹4,088.63 (S2), ₹4,153.76 (S3).
Resistance Levels: ₹4,221.13 (R1), ₹4,286.26 (R2), ₹4,353.63 (R3).
The current price of ₹4,216.00 is near the R1 resistance level, indicating potential for a breakout if the price surpasses this level.
📊 Trend Analysis
The stock is exhibiting strong bullish indicators across multiple timeframes, including the 1-hour chart. The RSI, MACD, and ADX all suggest a continuation of the upward trend. However, the overbought conditions indicated by the RSI, Stochastic Oscillator, and Williams %R suggest that traders should be cautious of potential short-term pullbacks.
I built a Buy & Sell Signal Indicator with 85% accuracy.
📈 Get access via DM or
WhatsApp: wa.link/adyqmn
Contact - +91 99997 64120
| Email: techncialexpress@gmail.com
| Script Coder | Trader | Investor | From India
📈 Get access via DM or
WhatsApp: wa.link/adyqmn
Contact - +91 99997 64120
| Email: techncialexpress@gmail.com
| Script Coder | Trader | Investor | From India
İlgili yayınlar
Feragatname
Bilgiler ve yayınlar, TradingView tarafından sağlanan veya onaylanan finansal, yatırım, alım satım veya diğer türden tavsiye veya öneriler anlamına gelmez ve teşkil etmez. Kullanım Koşulları bölümünde daha fazlasını okuyun.