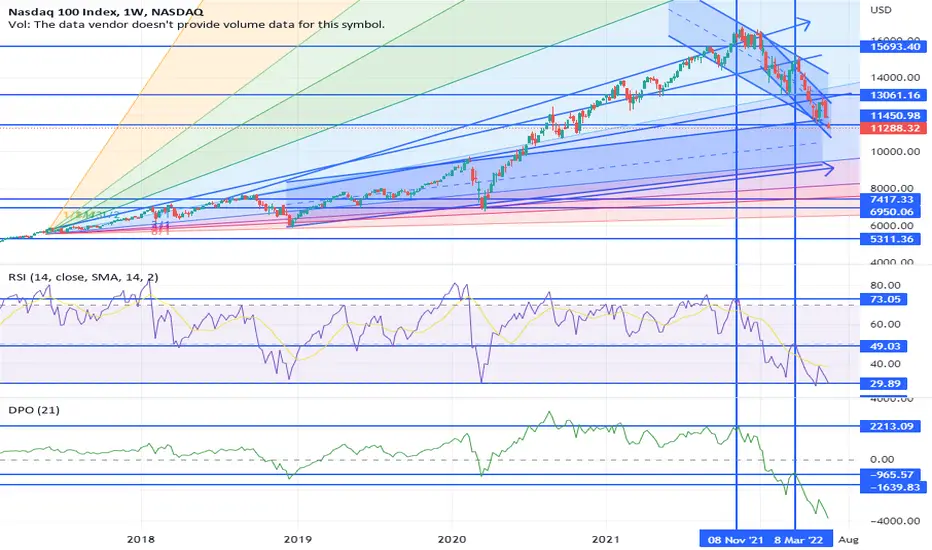
My idea is based on using parallel channels with two oscillators to find historical turning points. Assisting the basic idea with geometrical angles. What I would draw attention to is the unbelievable low reading on the DPO of about -3770. In this time series it has not been that low before (1991-2022). I am basically looking at waiting for a retest of the RSI at 49.03 and the DPO at -965. Actions will depend on what happens then. If it is rejected and then heads back lower this looks like a replay of the 2001-2002 bear market. If RSI finds support at 21.32 this could mark a bottom and be a time to start going long the Nasdaq 100. The rsi could also test 20.84 which was the low of 22/sept/2008. Either way on a successful retest of one of these numbers I think a 1% to 3% position size allocation would be an acceptable risk to take.
Feragatname
Bilgiler ve yayınlar, TradingView tarafından sağlanan veya onaylanan finansal, yatırım, işlem veya diğer türden tavsiye veya tavsiyeler anlamına gelmez ve teşkil etmez. Kullanım Şartları'nda daha fazlasını okuyun.
Feragatname
Bilgiler ve yayınlar, TradingView tarafından sağlanan veya onaylanan finansal, yatırım, işlem veya diğer türden tavsiye veya tavsiyeler anlamına gelmez ve teşkil etmez. Kullanım Şartları'nda daha fazlasını okuyun.