Natural Gas (NG) Weekly Breakout Brewing — 80% Upside Potential!
Current Price: $3.090
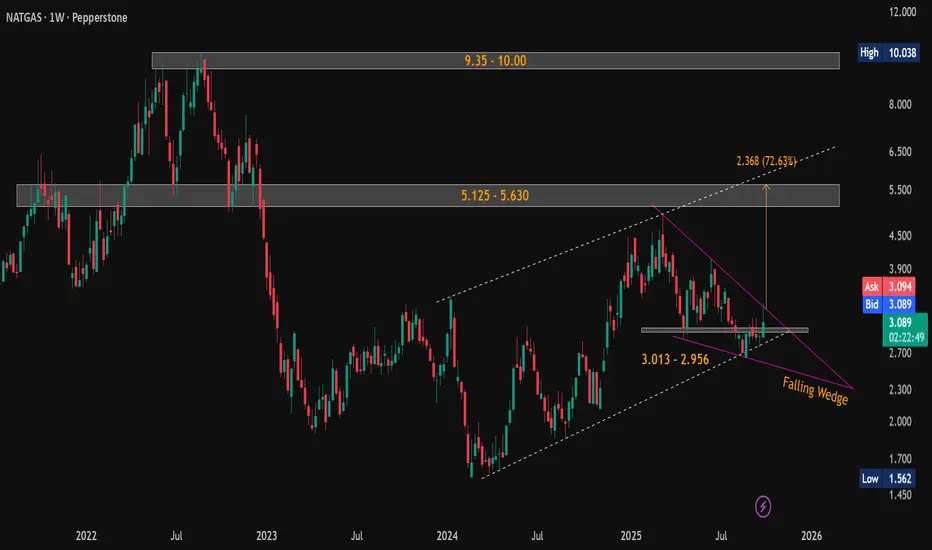
Technical View (Weekly Timeframe):
Natural Gas has formed a classic falling wedge pattern on the weekly chart - a strong bullish reversal setup. Price action is currently on the verge of breakout, with increasing volume and narrowing range suggesting imminent movement.
🟢 Strong Support Zones:
$3.013 – $2.956
$2.692 – $2.643
🔺 Key Resistance / Upside Targets:
Short-term: $5.125 – $5.630 (Pattern target: $5.625)
Long-term: $9.35 – $10.00
📈 The pattern breakout target of $5.625 aligns closely with the major resistance zone of $5.125 – $5.630, representing a potential ~80% upside from current levels.
Look for confirmed breakout above the wedge resistance with strong volume for trend continuation.
#NaturalGas | #NG | #FallingWedge | #ChartPatterns | #TechnicalAnalysis | #PriceAction
📌 Disclaimer: This analysis is shared for educational purposes only. It is not a buy/sell recommendation. Please do your own research before making any trading decisions.
Feragatname
Bilgiler ve yayınlar, TradingView tarafından sağlanan veya onaylanan finansal, yatırım, alım satım veya diğer türden tavsiye veya öneriler anlamına gelmez ve teşkil etmez. Kullanım Koşulları bölümünde daha fazlasını okuyun.
Feragatname
Bilgiler ve yayınlar, TradingView tarafından sağlanan veya onaylanan finansal, yatırım, alım satım veya diğer türden tavsiye veya öneriler anlamına gelmez ve teşkil etmez. Kullanım Koşulları bölümünde daha fazlasını okuyun.