Closing Price: 23,716.40 (16th Aug 2025, 2:05 AM UTC+4)
Analysis Methods: Japanese Candlesticks, Harmonic Patterns (ABCD, M/W), Elliott Wave, Wyckoff, Gann Theory (Time/Square of 9/Angles), Ichimoku, RSI, Bollinger Bands, VWAP, Moving Averages (MA/EMA/SMA/WMA).
1. Long-Term Trend (Weekly/Monthly)
Elliott Wave:
Gann Price Forecasting:
Ichimoku (Weekly):
Moving Averages:
2. Medium-Term Swing (4H/Daily)
Harmonic Patterns:
Bearish ABCD on 4H:
Wyckoff Phase:
Gann Theory:
Indicators:
RSI(14) + Bollinger Bands (Daily):
Swing Trade Setup:
3. Intraday Outlook (5M–4H)
Key Levels:
Indicators:
Ichimoku (1H):
RSI + Bollinger Bands (1H):
RSI(14): 60 (neutral).
Price pinned to upper BB(20,2) – overextended above 23,730.
VWAP + MAs:
Candlestick Patterns:
Gann Intraday Squaring:
Intraday Trade Plan:
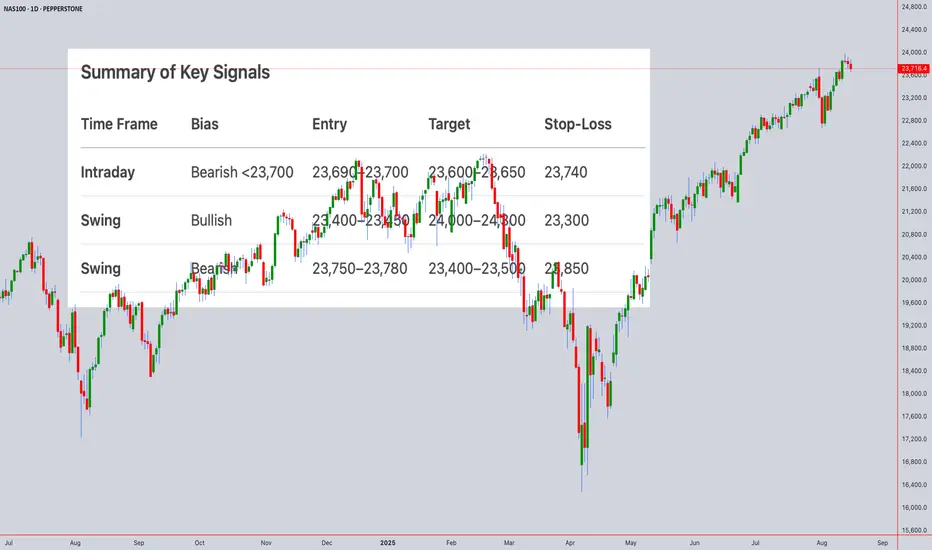
Summary of Key Signals
Time Frame Bias Entry Target Stop-Loss
Intraday Bearish <23,700 23,690–23,700 23,600–23,650 23,740
Swing Bullish 23,400–23,450 24,000–24,300 23,300
Swing Bearish 23,750–23,780 23,400–23,500 23,850
Critical Events Ahead:
Risk Note: NAS100 is sensitive to interest rate expectations. Tight stops advised in FOMC blackout period.
For those interested in further developing their trading skills based on these types of analyses, consider exploring the mentoring program offered by Shunya dot Trade.(world wide web shunya dot trade)
I welcome your feedback on this analysis, as it will inform and enhance my future work.
Regards,
Shunya.Trade
world wide web shunya dot trade
⚠️ Disclaimer: This post is educational content and does not constitute investment advice, financial advice, or trading recommendations. The views expressed here are based on technical analysis and are shared solely for informational purposes. The stock market is subject to risks, including capital loss, and readers should exercise due diligence before investing. We do not take responsibility for decisions made based on this content. Consult a certified financial advisor for personalized guidance.
Analysis Methods: Japanese Candlesticks, Harmonic Patterns (ABCD, M/W), Elliott Wave, Wyckoff, Gann Theory (Time/Square of 9/Angles), Ichimoku, RSI, Bollinger Bands, VWAP, Moving Averages (MA/EMA/SMA/WMA).
1. Long-Term Trend (Weekly/Monthly)
Elliott Wave:
NAS100 is likely in Wave (V) of a multi-year bull cycle (Wave III peak: 24,500 in Jul 2025, Wave IV correction to 22,800).
*Target: 24,800–25,200 for Wave V completion (1.618 extension of Wave I).
Gann Price Forecasting:
- Square of 9: √23,716.40 ≈ 154.00 → Key resistance at 155² = 24,025, then 156² = 24,336.
- Major Support: 153² = 23,409 (Gann 45° angle).
Ichimoku (Weekly):
- Tenkan/Kijun: Bullish crossover (Tenkan: 23,200 > Kijun: 22,900).
- Cloud: Price above thick Senkou Span (23,000–23,300) – bullish momentum.
Moving Averages:
- Monthly EMA(50): 22,500 (primary trend support).
- Swing Outlook: Bullish but extended. Final Wave V rally possible to 24,800–25,200.
2. Medium-Term Swing (4H/Daily)
Harmonic Patterns:
Bearish ABCD on 4H:
- A: 23,900 → B: 23,400 → C: 23,800 → D: 23,730–23,750 (1.272 BC extension).
- Bullish Bat (M Pattern) on daily: Potential reversal zone near 23,400 (0.886 XA retracement).
Wyckoff Phase:
- Distribution signs above 23,700:
- Upthrust at 23,780 (15th Aug) on declining volume.
- Lack of demand above 23,750.
Gann Theory:
- Time Window: Aug 19–21 (Square of 9 date cluster) for reversal risk.
- Price-Time Squaring: 23,716 aligns with Aug 16 – watch for consolidation.
Indicators:
RSI(14) + Bollinger Bands (Daily):
- RSI: 67 (neutral-bullish, not overbought).
- Price testing upper BB(20,2) at 23,750 – band expansion suggests volatility.
- VWAP (Daily): 23,600 (swing support).
Swing Trade Setup:
- Short near 23,750 (ABCD target) → Target 23,400. Stop-loss: 23,850.
- Long near 23,400 (Bat + Gann 153² support) → Target 24,000. Stop-loss: 23,300.
3. Intraday Outlook (5M–4H)
Key Levels:
- Resistance: 23,750 (Gann 1x1 angle), 23,800 (psychological).
- Support: 23,650 (VWAP), 23,600 (Kijun Sen), 23,500 (200-EMA).
Indicators:
Ichimoku (1H):
- Tenkan: 23,710, Kijun: 23,680 → Price straddling Kijun (neutral bias).
- Cloud: Thin bullish cloud (23,650–23,670) – intraday support.
RSI + Bollinger Bands (1H):
RSI(14): 60 (neutral).
Price pinned to upper BB(20,2) – overextended above 23,730.
VWAP + MAs:
- VWAP: 23,650 (intraday baseline).
- EMA(20): 23,700 (dynamic resistance).
Candlestick Patterns:
- 4H Shooting Star at 23,780 (15th Aug) → Bearish reversal signal.
- 1H Bearish Engulfing below 23,720 – confirms short-term weakness.
Gann Intraday Squaring:
- Time Cycles: 10:00–12:00 UTC+4 (geometric volatility window).
*Price Harmony: Breakdown below 23,700 targets 23,650 → 23,600.
Intraday Trade Plan:
- Sell below 23,700 → Target 23,650 (VWAP) → 23,600 (1H cloud).
- Buy above 23,750 only if RSI <65 → Target 23,800.
- Stop-Loss: 30–40 points risk.
Summary of Key Signals
Time Frame Bias Entry Target Stop-Loss
Intraday Bearish <23,700 23,690–23,700 23,600–23,650 23,740
Swing Bullish 23,400–23,450 24,000–24,300 23,300
Swing Bearish 23,750–23,780 23,400–23,500 23,850
Critical Events Ahead:
- Gann Reversal Window: Aug 19–21 (watch for tech earnings/Fed minutes).
- Daily Close >23,800 invalidates bearish ABCD and targets 24,025.
Risk Note: NAS100 is sensitive to interest rate expectations. Tight stops advised in FOMC blackout period.
For those interested in further developing their trading skills based on these types of analyses, consider exploring the mentoring program offered by Shunya dot Trade.(world wide web shunya dot trade)
I welcome your feedback on this analysis, as it will inform and enhance my future work.
Regards,
Shunya.Trade
world wide web shunya dot trade
⚠️ Disclaimer: This post is educational content and does not constitute investment advice, financial advice, or trading recommendations. The views expressed here are based on technical analysis and are shared solely for informational purposes. The stock market is subject to risks, including capital loss, and readers should exercise due diligence before investing. We do not take responsibility for decisions made based on this content. Consult a certified financial advisor for personalized guidance.
I am nothing @shunya.trade
Feragatname
Bilgiler ve yayınlar, TradingView tarafından sağlanan veya onaylanan finansal, yatırım, işlem veya diğer türden tavsiye veya tavsiyeler anlamına gelmez ve teşkil etmez. Kullanım Şartları'nda daha fazlasını okuyun.
I am nothing @shunya.trade
Feragatname
Bilgiler ve yayınlar, TradingView tarafından sağlanan veya onaylanan finansal, yatırım, işlem veya diğer türden tavsiye veya tavsiyeler anlamına gelmez ve teşkil etmez. Kullanım Şartları'nda daha fazlasını okuyun.