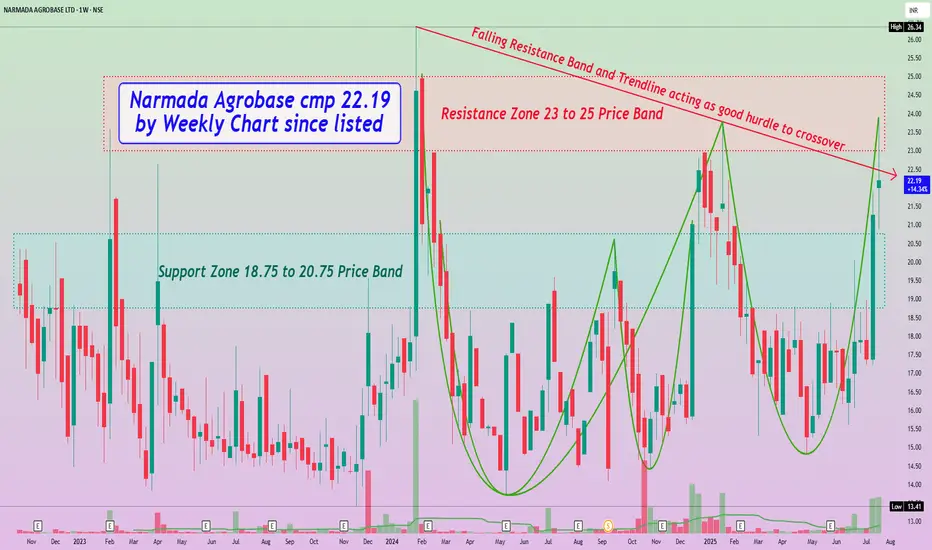
Narmada Agrobase cmp 22.19 by Weekly Chart since listed
- Support Zone 18.75 to 20.75 Price Band
- Resistance Zone seen at 23 to 25 Price Band
- Falling Resistance Band and Trendline acting as good hurdle to crossover
- Back to Back Bullish Rounding Bottoms formed at Resistance Zone neckline hurdle
- Volumes have spiked up heavily over past 2 weeks well above average traded quantity
- Most common Technical Indicators like BB, EMA, MACD, RSI, SAR are showing positive trend
Feragatname
Bilgiler ve yayınlar, TradingView tarafından sağlanan veya onaylanan finansal, yatırım, alım satım veya diğer türden tavsiye veya öneriler anlamına gelmez ve teşkil etmez. Kullanım Koşulları bölümünde daha fazlasını okuyun.
Feragatname
Bilgiler ve yayınlar, TradingView tarafından sağlanan veya onaylanan finansal, yatırım, alım satım veya diğer türden tavsiye veya öneriler anlamına gelmez ve teşkil etmez. Kullanım Koşulları bölümünde daha fazlasını okuyun.