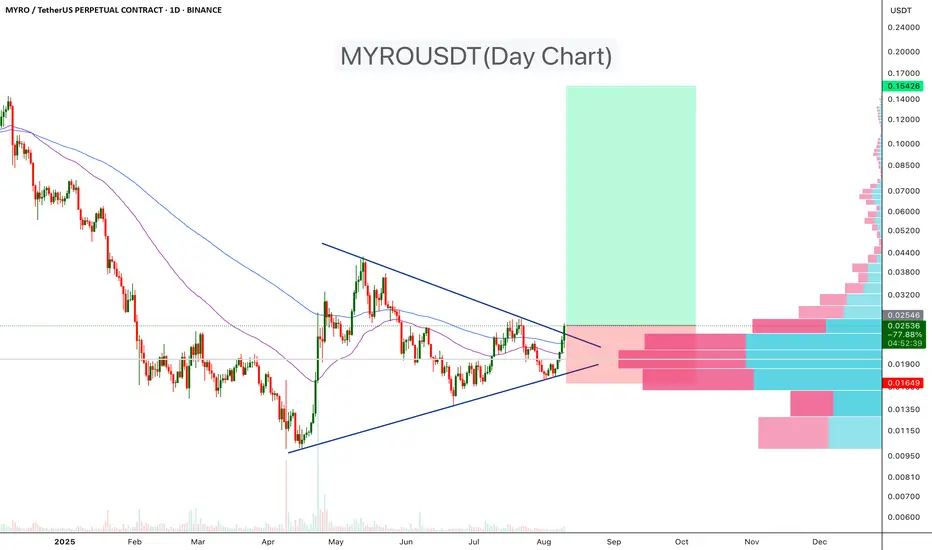
MYROUSDT has been trading within a symmetrical triangle pattern for the past few months. Today, the price has broken above the upper trendline, signaling a potential bullish breakout. The breakout is supported by increased volume and a clear move above both the 50-day and 100-day EMAs, suggesting strengthening bullish momentum.
Pattern: Symmetrical Triangle (Bullish breakout)
Breakout Confirmation: Price closed above the upper trendline with increased volume
Moving Averages: Trading above the 50 EMA and 100 EMA – bullish bias
Target: 150%–500%
Stop-loss: Below triangle support (~$0.0165)
Cheers
Hexa
Pattern: Symmetrical Triangle (Bullish breakout)
Breakout Confirmation: Price closed above the upper trendline with increased volume
Moving Averages: Trading above the 50 EMA and 100 EMA – bullish bias
Target: 150%–500%
Stop-loss: Below triangle support (~$0.0165)
Cheers
Hexa
🚀Telegram : t.me/hexatrades
🌐Website: hexatrades.io/
🗣️Twitter(X): twitter.com/HexaTrades
🌐Website: hexatrades.io/
🗣️Twitter(X): twitter.com/HexaTrades
İlgili yayınlar
Feragatname
Bilgiler ve yayınlar, TradingView tarafından sağlanan veya onaylanan finansal, yatırım, işlem veya diğer türden tavsiye veya tavsiyeler anlamına gelmez ve teşkil etmez. Kullanım Şartları'nda daha fazlasını okuyun.
