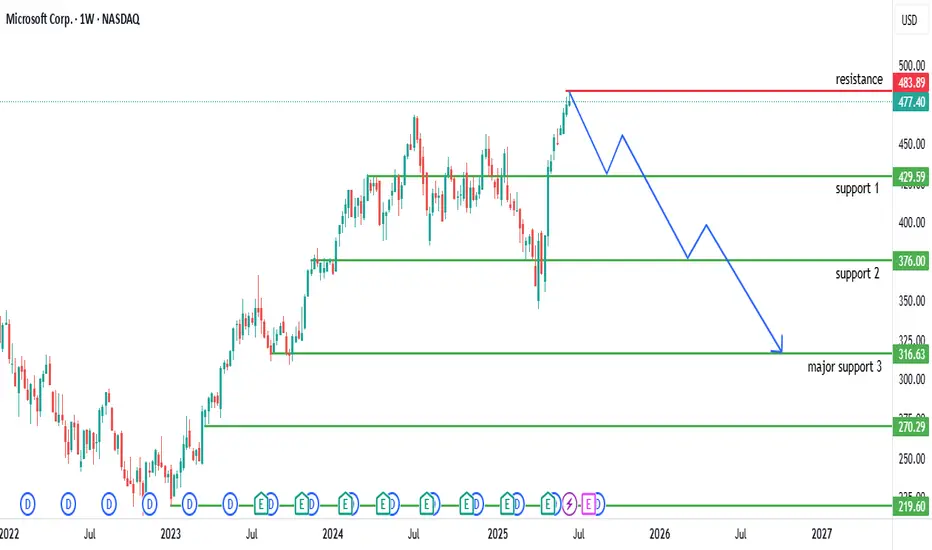
Historical Trend: The chart illustrates Microsoft Corp.'s stock price on a weekly timeframe from 2022 to mid-2025. The stock showed a steady upward trend from 2022 to early 2025, reflecting strong growth driven by its dominance in software and cloud computing.
Key Levels:
Resistance: The $483.89-$477.40 range (red line) has acted as a significant resistance level. The price recently tested this zone and appears to have faced rejection.
Support Levels:
Support 1: $425.59 (green line) served as a mid-range support during recent corrections.
Support 2: $376.00 (green line) acted as a stronger support level during prior consolidations.
Major Support 3: $316.63 (green line) represents a critical long-term support zone, tested during deeper pullbacks.
Recent Price Action: After approaching the resistance at $483.89, the stock experienced a sharp decline, forming a descending pattern (blue line). This suggests a potential bearish reversal or correction following the rejection at resistance.
Projected Movement: The downward projection indicates the stock could decline toward the $316.63 major support level if the bearish momentum continues. A break below $376.00 would confirm this trend, while a bounce from $425.59 could signal a potential recovery.
Volume and Indicators: The chart includes Bollinger Bands (O475.21 H483.46 L474.08 C477.40) with a -2.44 (-0.51%) change, indicating moderate volatility. The recent drop suggests selling pressure, though specific volume data is not detailed.
Outlook: The stock is currently in a bearish phase after failing to break above $483.89. Watch for a potential test of $425.59 or $376.00 supports. A recovery above $477.40 would indicate a resumption of the bullish trend, while a drop below $316.63 could signal a deeper correction.
Feragatname
Bilgiler ve yayınlar, TradingView tarafından sağlanan veya onaylanan finansal, yatırım, alım satım veya diğer türden tavsiye veya öneriler anlamına gelmez ve teşkil etmez. Kullanım Koşulları bölümünde daha fazlasını okuyun.
Feragatname
Bilgiler ve yayınlar, TradingView tarafından sağlanan veya onaylanan finansal, yatırım, alım satım veya diğer türden tavsiye veya öneriler anlamına gelmez ve teşkil etmez. Kullanım Koşulları bölümünde daha fazlasını okuyun.