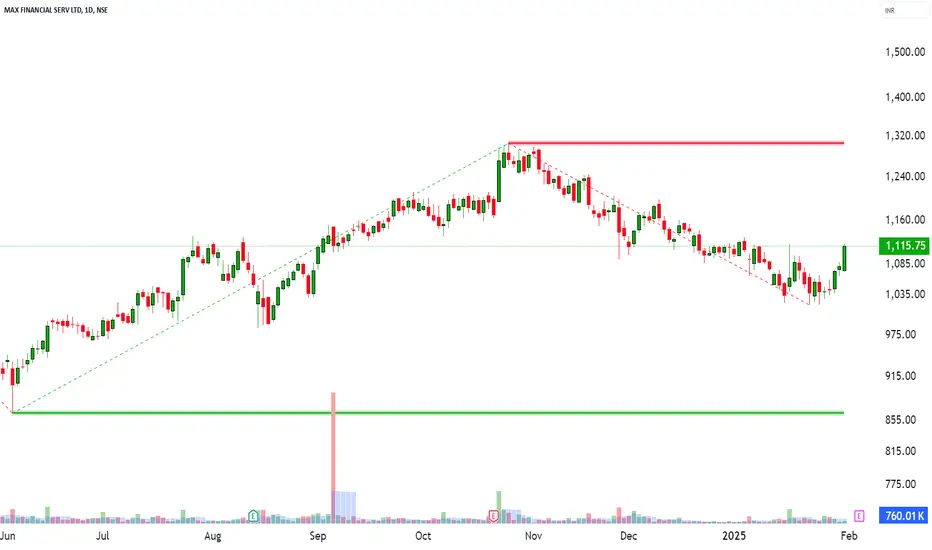
📅 Date: January 30, 2025
📊 Timeframe: Daily Chart
📌 Market Snapshot
🔹 Change: +34.15 points (+3.16%)
🔹 Volume: 331.73K (Below 20-day avg: 727.74K)(Keep a watch on volume)
🔹 Momentum Indicator: RSI breakout, EMA 200 Crossover
🔹 Strong Bullish Candle (Bullish Marubozu) forming
⚡ Levels to Watch
🔴 Key Resistance Zones (Above Current Price)
🚀 1,135.40 – Immediate hurdle
🚀 1,148.85 – Next breakout zone
🚀 1,177.75 – Major supply area
🟢 Key Support Zones (Below Current Price)
🔻 1,086.85 – Short-term support
🔻 1,057.95 – Key demand zone
🔻 1,041.40 – Strong base
🚀 Conclusion
MFSL is showing strong bullish momentum, backed by an RSI breakout and a 200 EMA crossover.
"Could the price sustaining above recent levels indicate further upward momentum, with a critical support zone in place?"
Feragatname
Bilgiler ve yayınlar, TradingView tarafından sağlanan veya onaylanan finansal, yatırım, işlem veya diğer türden tavsiye veya tavsiyeler anlamına gelmez ve teşkil etmez. Kullanım Şartları'nda daha fazlasını okuyun.
Feragatname
Bilgiler ve yayınlar, TradingView tarafından sağlanan veya onaylanan finansal, yatırım, işlem veya diğer türden tavsiye veya tavsiyeler anlamına gelmez ve teşkil etmez. Kullanım Şartları'nda daha fazlasını okuyun.