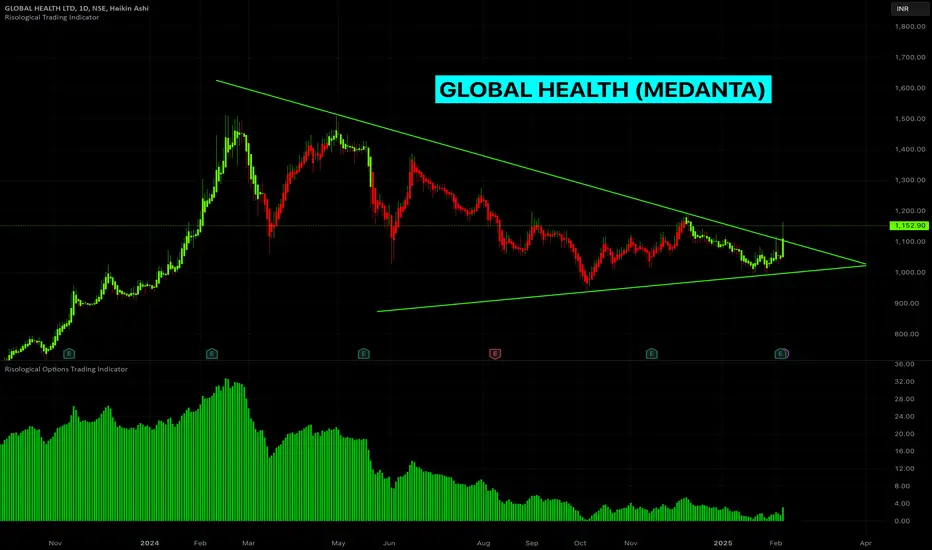
This is still an open candle and need to wait till this candle closes in GREEN on Friday end of the day. If the candle is green and is clearly breaking out from the triangle on Friday, it is a Bullish sign.
On the daily time frame, the daily candle has closed in GREEN, which is a good sign.
The Risological indicators confirm the bullish movement as seen below.

ENTRY:
EXIT:
Hope this helps!
Cheers!
__All info = educational only__
On the daily time frame, the daily candle has closed in GREEN, which is a good sign.
The Risological indicators confirm the bullish movement as seen below.
ENTRY:
- The stock can be purchased on the daily time frame as the Risological indicators gave the confirmation
EXIT:
- Hold the BUY position till the Risological indicator gives a reversal
- Exit on first RED candle close on the daily time frame.
- OR, Exit if the Risological options trading indicator turns into RED.
Hope this helps!
Cheers!
__All info = educational only__
- Supercharge your trading with > Risological.com
- 30-Day Money Back Guarantee!
- Accurate Entry, Stoploss and Take Profit levels
- NO Repaint
- Detects Sideways Market
- Limited time discount available. HURRY!
- 30-Day Money Back Guarantee!
- Accurate Entry, Stoploss and Take Profit levels
- NO Repaint
- Detects Sideways Market
- Limited time discount available. HURRY!
İlgili yayınlar
Feragatname
Bilgiler ve yayınlar, TradingView tarafından sağlanan veya onaylanan finansal, yatırım, işlem veya diğer türden tavsiye veya tavsiyeler anlamına gelmez ve teşkil etmez. Kullanım Şartları'nda daha fazlasını okuyun.