Güncellendi
Uptrend turning point : 0.9483
Hello traders!
If you "Follow" us, you can always get new information quickly.
Please also click “Boost”.
Have a good day.
-------------------------------------
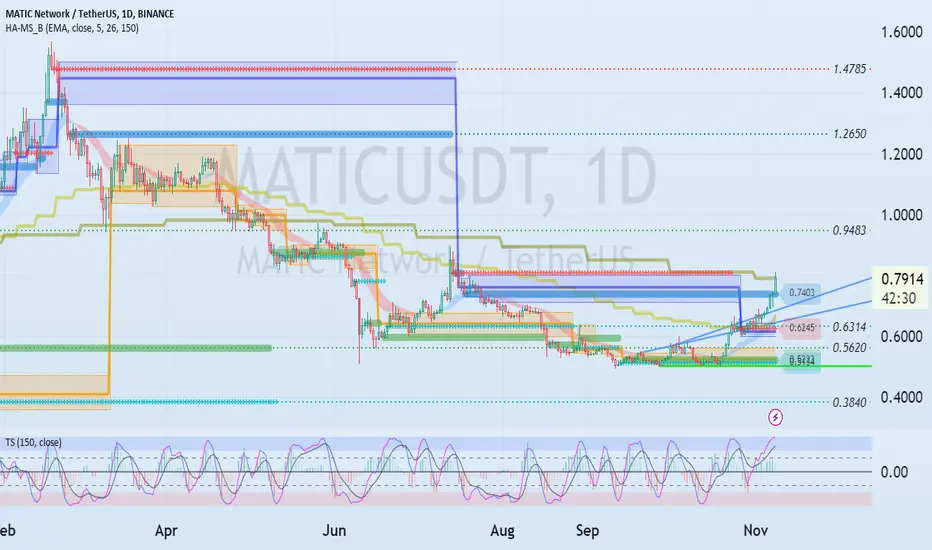
(MATICUSDT chart)

(1M charts)

Since it has not yet risen above the MS-Signal indicator, it is difficult to say that it has turned into an upward trend.
Accordingly, the key is whether it can rise above 0.9279.
(1W chart)

The key is whether the price can be maintained above 0.7529 and rise above 0.9391.
(1D chart)

Looking at the overall picture, I think the range from 0.3840-0.5620 to 0.9483 is an important support and resistance range.
Accordingly, the direction in which one deviates from this section is important.

This is the current 1M chart's M-Signal indicator touched.
Therefore, the key is whether it can rise above the M-Signal indicator on the 1M chart and rise above 0.9483.
If this is not the case and it falls below 0.7403, there is a possibility that it may fall to around 0.6314, so you need to think about a response plan.
If the price rises above 0.9483 and holds, it is expected to turn into an upward trend.
--------------------------------------------------
- The big picture

The full-fledged upward trend is expected to begin when the price rises above 29K.
This is the section expected to be touched in the next bull market, 81K-95K.
-------------------------------------------------- -------------------------------------------
** All explanations are for reference only and do not guarantee profit or loss in investment.
** Trading volume is displayed as a candle body based on 10EMA.
How to display (in order from darkest to darkest)
More than 3 times the trading volume of 10EMA > 2.5 times > 2.0 times > 1.25 times > Trading volume below 10EMA
** Even if you know other people’s know-how, it takes a considerable amount of time to make it your own.
** This chart was created using my know-how.
---------------------------------
If you "Follow" us, you can always get new information quickly.
Please also click “Boost”.
Have a good day.
-------------------------------------
(MATICUSDT chart)
(1M charts)
Since it has not yet risen above the MS-Signal indicator, it is difficult to say that it has turned into an upward trend.
Accordingly, the key is whether it can rise above 0.9279.
(1W chart)
The key is whether the price can be maintained above 0.7529 and rise above 0.9391.
(1D chart)
Looking at the overall picture, I think the range from 0.3840-0.5620 to 0.9483 is an important support and resistance range.
Accordingly, the direction in which one deviates from this section is important.
This is the current 1M chart's M-Signal indicator touched.
Therefore, the key is whether it can rise above the M-Signal indicator on the 1M chart and rise above 0.9483.
If this is not the case and it falls below 0.7403, there is a possibility that it may fall to around 0.6314, so you need to think about a response plan.
If the price rises above 0.9483 and holds, it is expected to turn into an upward trend.
--------------------------------------------------
- The big picture
The full-fledged upward trend is expected to begin when the price rises above 29K.
This is the section expected to be touched in the next bull market, 81K-95K.
-------------------------------------------------- -------------------------------------------
** All explanations are for reference only and do not guarantee profit or loss in investment.
** Trading volume is displayed as a candle body based on 10EMA.
How to display (in order from darkest to darkest)
More than 3 times the trading volume of 10EMA > 2.5 times > 2.0 times > 1.25 times > Trading volume below 10EMA
** Even if you know other people’s know-how, it takes a considerable amount of time to make it your own.
** This chart was created using my know-how.
---------------------------------
Not
#MATICUSDT #MATICThe key is whether the price can be maintained by quickly rising above 0.7529.
If that happens, I think there is a possibility of a full-fledged upward trend when BTC rises.
Not
#MATICUSDTIf the price rises above 0.9279 and holds, it is expected that a full-fledged upward trend will begin.
(1D)
Accordingly, the key is whether it can receive support and rise in the 0.8491-0.9279 range.
※ Follow X to check out the posts.
※ X를 팔로우하고 게시물을 확인하세요.
◆ t.me/readCryptoChannel
[HA-MS Indicator]
bit.ly/3YxHgvN
[OBV Indicator]
bit.ly/4dcyny3
※ X를 팔로우하고 게시물을 확인하세요.
◆ t.me/readCryptoChannel
[HA-MS Indicator]
bit.ly/3YxHgvN
[OBV Indicator]
bit.ly/4dcyny3
İlgili yayınlar
Feragatname
Bilgiler ve yayınlar, TradingView tarafından sağlanan veya onaylanan finansal, yatırım, alım satım veya diğer türden tavsiye veya öneriler anlamına gelmez ve teşkil etmez. Kullanım Koşulları bölümünde daha fazlasını okuyun.