Alış
MATIC: Support Breakout
Polygon (MATIC) technical analysis:
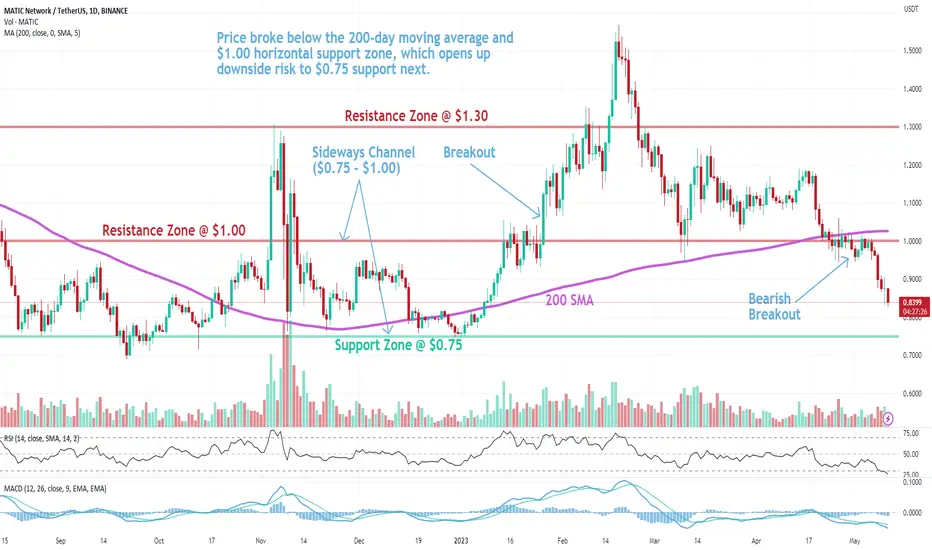
Trade setup: Price broke below the 200-day moving average and $1.00 horizontal support zone, which opens up downside risk to $0.75 support next.
Trend: Downtrend across all time horizons (Short- Medium- and Long-Term).
Momentum is Bearish (MACD Line is below MACD Signal Line, and RSI is below 45).
Support and Resistance: Nearest Support Zone is $0.75. The nearest Resistance Zone is $1.00 (previous support), then $1.30.
Feragatname
Bilgiler ve yayınlar, TradingView tarafından sağlanan veya onaylanan finansal, yatırım, işlem veya diğer türden tavsiye veya tavsiyeler anlamına gelmez ve teşkil etmez. Kullanım Şartları'nda daha fazlasını okuyun.
Feragatname
Bilgiler ve yayınlar, TradingView tarafından sağlanan veya onaylanan finansal, yatırım, işlem veya diğer türden tavsiye veya tavsiyeler anlamına gelmez ve teşkil etmez. Kullanım Şartları'nda daha fazlasını okuyun.