MATIC price action shows a potential bullish reversal.
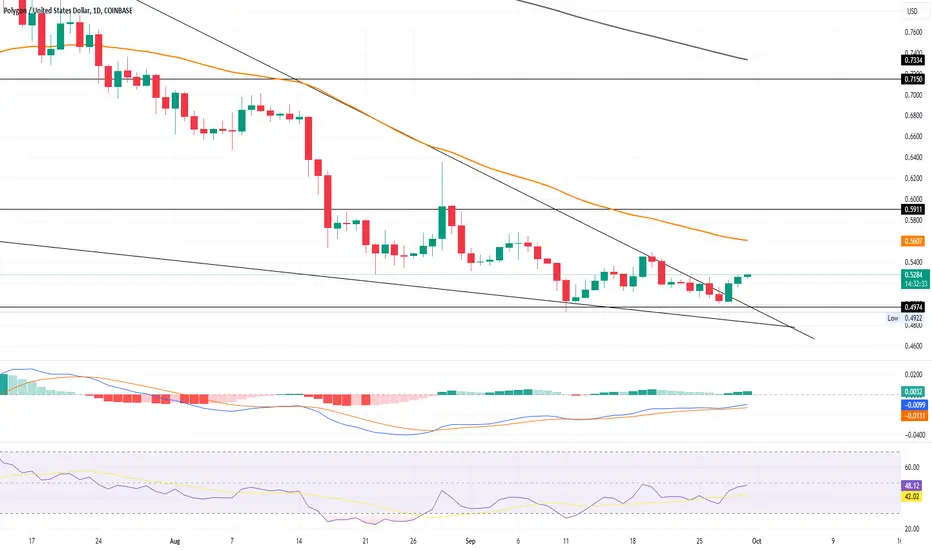
The 50-day EMA has been a major resistance, keeping bullish growth in check.
A trendline breakout could unleash a new bullish rally.
MATIC has been in a long-term downtrend, leading to a death cross.
Recent support found at $0.49, teasing a potential reversal.
The price is currently trading at $0.52, with a 5.23% jump in the last two days.
A double bottom pattern is forming, signaling a potential trend reversal.
A morning star pattern has also formed, adding to bullish indicators.
MACD and signal lines avoid a bearish crossover, indicating bullish momentum.
RSI struggles to break above the halfway mark but remains above the 14-day SMA.
Upcoming resistance levels are at $0.59 and $0.71.
Failure to sustain the uptrend could see the price drop to $0.42.
Feragatname
Bilgiler ve yayınlar, TradingView tarafından sağlanan veya onaylanan finansal, yatırım, işlem veya diğer türden tavsiye veya tavsiyeler anlamına gelmez ve teşkil etmez. Kullanım Şartları'nda daha fazlasını okuyun.
Feragatname
Bilgiler ve yayınlar, TradingView tarafından sağlanan veya onaylanan finansal, yatırım, işlem veya diğer türden tavsiye veya tavsiyeler anlamına gelmez ve teşkil etmez. Kullanım Şartları'nda daha fazlasını okuyun.