## MARA Technical Analysis & Market Outlook
### **Elliott Wave Structure (1→5)**
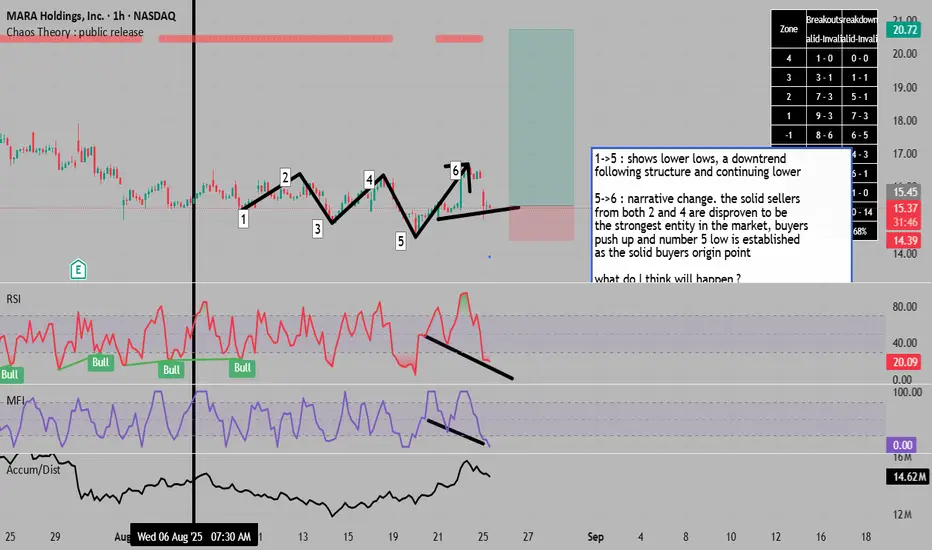
The decline from wave 1 to 5 traced a clear five-wave impulsive move lower, establishing a downtrend with progressively lower lows. This bearish sequence bottomed around $10, marking the completion of the corrective phase.
### **Market Structure Shift (5→6)**
Wave 5 marked a critical inflection point. The subsequent rally to wave 6 (~$21) invalidated the bearish control established at waves 2 and 4, confirming that selling pressure had been exhausted. This pivot established the $10-14 zone as the **"smart money" accumulation area** - a level now being retested.
### **Current Setup at $15.47**
We've returned to this proven demand zone with multiple confluence factors:
**Technical Indicators:**
- **Inside candle formation** after aggressive selling - classic equilibrium pattern suggesting seller exhaustion
- **Bullish divergence** on RSI (currently 36.76) and MFI - price making lower lows while momentum indicators show higher lows
- **Oversold conditions** across multiple timeframes with RSI in the 30s
- Testing the **critical $14-15 support zone** that sparked the previous 100%+ rally
**Market Context:**
- Analysts maintain **$22.95 average price target** (47% upside) with targets ranging to $39
- 8 Buy ratings vs 0 Sell ratings from Wall Street analysts
- Bitcoin correlation remains strong, with BTC targeting $140,000 by year-end per Elliott Wave analysis
- Institutional accumulation continuing via ETFs despite recent price weakness
### **Trade Thesis**
The convergence of oversold technicals, bullish divergence, and a retest of proven support creates an asymmetric risk/reward opportunity. The inside candle represents the market catching its breath before the next directional move. Given that:
1. Previous buyers defended this zone aggressively (wave 5→6 move)
2. Momentum indicators are flashing oversold with positive divergence
3. Analyst consensus sees 40-50% upside to fair value
4. Bitcoin's broader trend remains intact with $140k targets
**The probability favors a bounce from current levels back toward $20-23 initial targets, with $14 as a clear stop-loss level.**
### **Risk Management**
- **Entry Zone**: $15-16
- **Stop Loss**: Below $14 (wave 5 low)
- **Initial Target**: $20-23 (analyst consensus range)
- **Secondary Target**: $25+ (if Bitcoin reaches $140k projections)
- **Risk/Reward**: ~1:3 minimum
The market has shown its hand - buyers step in aggressively at these levels. Until proven otherwise, this zone should act as a springboard for the next leg higher.
### **Elliott Wave Structure (1→5)**
The decline from wave 1 to 5 traced a clear five-wave impulsive move lower, establishing a downtrend with progressively lower lows. This bearish sequence bottomed around $10, marking the completion of the corrective phase.
### **Market Structure Shift (5→6)**
Wave 5 marked a critical inflection point. The subsequent rally to wave 6 (~$21) invalidated the bearish control established at waves 2 and 4, confirming that selling pressure had been exhausted. This pivot established the $10-14 zone as the **"smart money" accumulation area** - a level now being retested.
### **Current Setup at $15.47**
We've returned to this proven demand zone with multiple confluence factors:
**Technical Indicators:**
- **Inside candle formation** after aggressive selling - classic equilibrium pattern suggesting seller exhaustion
- **Bullish divergence** on RSI (currently 36.76) and MFI - price making lower lows while momentum indicators show higher lows
- **Oversold conditions** across multiple timeframes with RSI in the 30s
- Testing the **critical $14-15 support zone** that sparked the previous 100%+ rally
**Market Context:**
- Analysts maintain **$22.95 average price target** (47% upside) with targets ranging to $39
- 8 Buy ratings vs 0 Sell ratings from Wall Street analysts
- Bitcoin correlation remains strong, with BTC targeting $140,000 by year-end per Elliott Wave analysis
- Institutional accumulation continuing via ETFs despite recent price weakness
### **Trade Thesis**
The convergence of oversold technicals, bullish divergence, and a retest of proven support creates an asymmetric risk/reward opportunity. The inside candle represents the market catching its breath before the next directional move. Given that:
1. Previous buyers defended this zone aggressively (wave 5→6 move)
2. Momentum indicators are flashing oversold with positive divergence
3. Analyst consensus sees 40-50% upside to fair value
4. Bitcoin's broader trend remains intact with $140k targets
**The probability favors a bounce from current levels back toward $20-23 initial targets, with $14 as a clear stop-loss level.**
### **Risk Management**
- **Entry Zone**: $15-16
- **Stop Loss**: Below $14 (wave 5 low)
- **Initial Target**: $20-23 (analyst consensus range)
- **Secondary Target**: $25+ (if Bitcoin reaches $140k projections)
- **Risk/Reward**: ~1:3 minimum
The market has shown its hand - buyers step in aggressively at these levels. Until proven otherwise, this zone should act as a springboard for the next leg higher.
all my paid ( pro ) scripts can be obtained for a low price of 19.99 / month at : whop.com/sabr-pro-tools/access-to-all-pro-tools/
Feragatname
Bilgiler ve yayınlar, TradingView tarafından sağlanan veya onaylanan finansal, yatırım, alım satım veya diğer türden tavsiye veya öneriler anlamına gelmez ve teşkil etmez. Kullanım Koşulları bölümünde daha fazlasını okuyun.