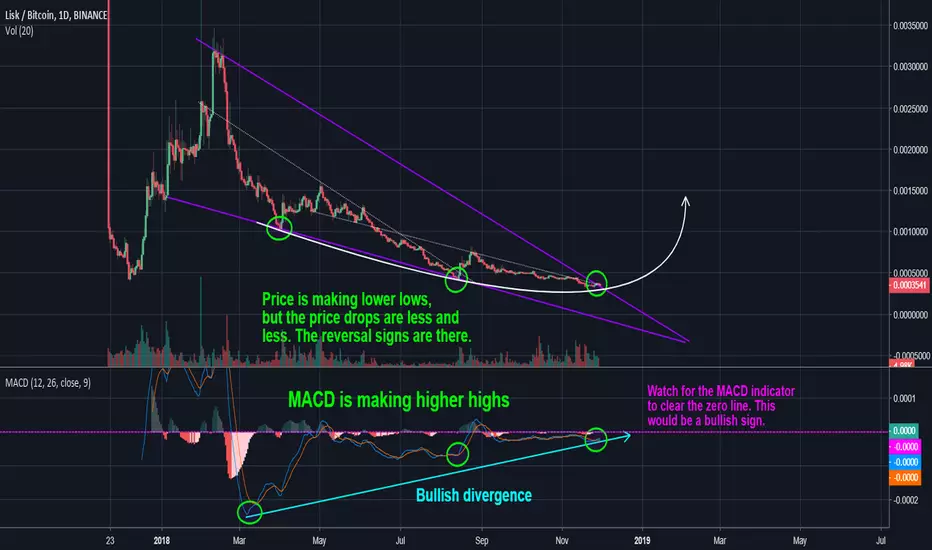
Taking a look at the daily chart for Lisk, we can see several bullish indicators and signs of reversal. Huge bullish divergence can be seen on the MACD with higher highs being made while the price is making lower lows. This usually indicates a reversal in the price action is imminent. The MACD is also approaching the zero line, which would be another positive sign for the bulls. Divergence can all be seen on the RSI indicator as well. Keep an eye out for a breakout to the upside. The gains over the next couple months could be big.
Feragatname
Bilgiler ve yayınlar, TradingView tarafından sağlanan veya onaylanan finansal, yatırım, işlem veya diğer türden tavsiye veya tavsiyeler anlamına gelmez ve teşkil etmez. Kullanım Şartları'nda daha fazlasını okuyun.
Feragatname
Bilgiler ve yayınlar, TradingView tarafından sağlanan veya onaylanan finansal, yatırım, işlem veya diğer türden tavsiye veya tavsiyeler anlamına gelmez ve teşkil etmez. Kullanım Şartları'nda daha fazlasını okuyun.
