KSM 1W chart has a Desending tringle pattern that has been broke
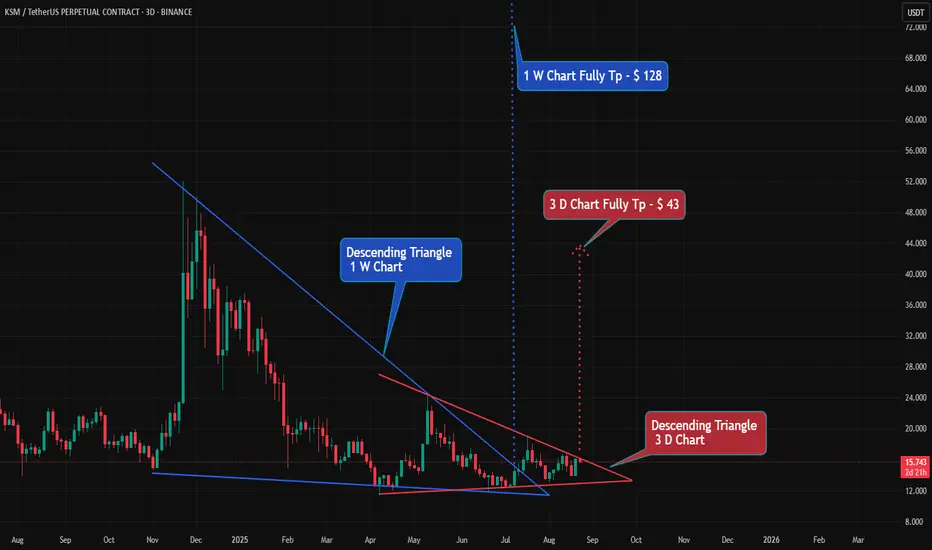
#KSM 1W chart has a Desending tringle pattern that has been broken. 🔼🔼
#KMS Coin is currently forming a Descending Triangle pattern on the 3D chart.
👀 When the market reaches the $723 level, 👀 it shows a double bottom pattern. If it also breaks out, it can rise to $1060.🔼
💵 Tp 1 : $ 443
💵 Tp 2 : $ 499
💵 Tp 3 : $ 575
💵 Tp 4 : $ 723
💵 Tp 5 : $ 1060
#KMS Coin is currently forming a Descending Triangle pattern on the 3D chart.
👀 When the market reaches the $723 level, 👀 it shows a double bottom pattern. If it also breaks out, it can rise to $1060.🔼
💵 Tp 1 : $ 443
💵 Tp 2 : $ 499
💵 Tp 3 : $ 575
💵 Tp 4 : $ 723
💵 Tp 5 : $ 1060
Feragatname
Bilgiler ve yayınlar, TradingView tarafından sağlanan veya onaylanan finansal, yatırım, alım satım veya diğer türden tavsiye veya öneriler anlamına gelmez ve teşkil etmez. Kullanım Koşulları bölümünde daha fazlasını okuyun.
Feragatname
Bilgiler ve yayınlar, TradingView tarafından sağlanan veya onaylanan finansal, yatırım, alım satım veya diğer türden tavsiye veya öneriler anlamına gelmez ve teşkil etmez. Kullanım Koşulları bölümünde daha fazlasını okuyun.