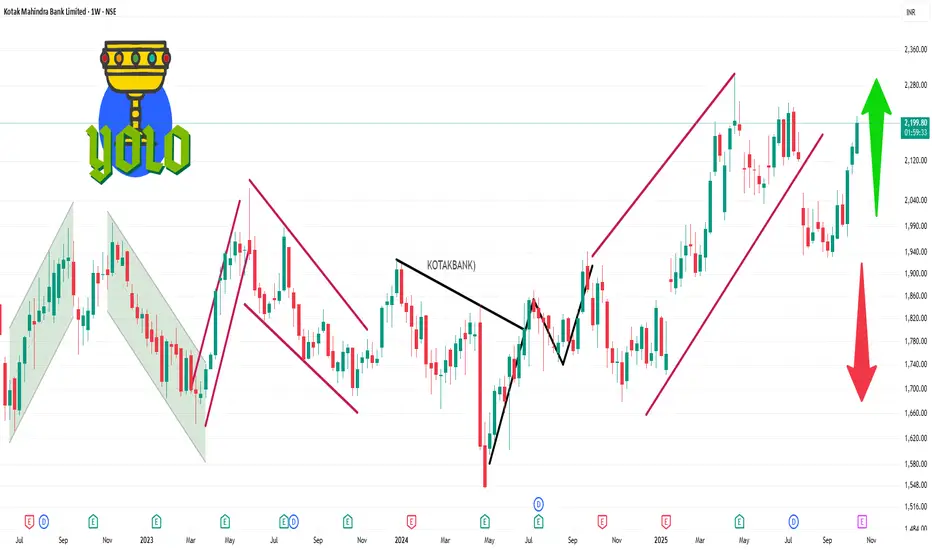
📊 Weekly Support and Resistance Levels
Immediate Support Levels: ₹2,109.47, ₹2,068.83, ₹2,044.67
Immediate Resistance Levels: ₹2,174.27, ₹2,198.43, ₹2,239.07
A decisive move above ₹2,174.27 could signal a bullish breakout, while a drop below ₹2,109.47 may indicate a bearish trend.
📈 Technical Indicators Summary
RSI (14): 73.44 — Indicates potential overbought conditions.
MACD: 46.92 — Suggests bullish momentum.
ADX (14): 32.50 — Reflects a strong trend.
EMA (5): ₹2,176.59 — Indicates short-term bullishness.
EMA (50): ₹2,067.60 — Supports medium-term bullish outlook.
EMA (200): ₹2,057.89 — Confirms long-term bullish trend.
İlgili yayınlar
Feragatname
Bilgiler ve yayınlar, TradingView tarafından sağlanan veya onaylanan finansal, yatırım, alım satım veya diğer türden tavsiye veya öneriler anlamına gelmez ve teşkil etmez. Kullanım Koşulları bölümünde daha fazlasını okuyun.
İlgili yayınlar
Feragatname
Bilgiler ve yayınlar, TradingView tarafından sağlanan veya onaylanan finansal, yatırım, alım satım veya diğer türden tavsiye veya öneriler anlamına gelmez ve teşkil etmez. Kullanım Koşulları bölümünde daha fazlasını okuyun.