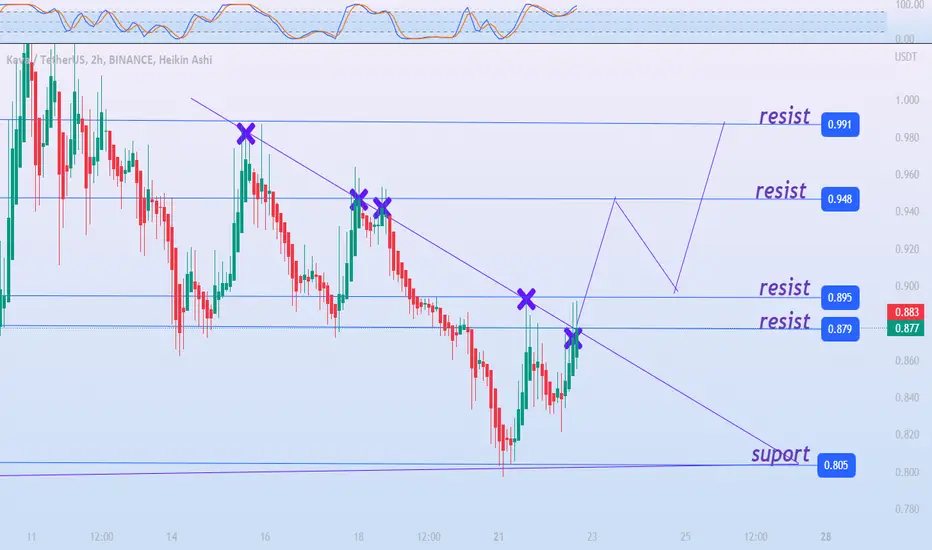
The above graph of Kava (KAVA) shows a triangle pattern. This pattern is being broken as the graph shows. The oversold indicated by the RSI may push the price of KAVA towards 0.852. It follows its supports and resistances.
Supports: 0.852 / 0.805
Resistances: 0.895 / 0.948 / 0.991
Supports: 0.852 / 0.805
Resistances: 0.895 / 0.948 / 0.991
Feragatname
Bilgiler ve yayınlar, TradingView tarafından sağlanan veya onaylanan finansal, yatırım, işlem veya diğer türden tavsiye veya tavsiyeler anlamına gelmez ve teşkil etmez. Kullanım Şartları'nda daha fazlasını okuyun.
Feragatname
Bilgiler ve yayınlar, TradingView tarafından sağlanan veya onaylanan finansal, yatırım, işlem veya diğer türden tavsiye veya tavsiyeler anlamına gelmez ve teşkil etmez. Kullanım Şartları'nda daha fazlasını okuyun.