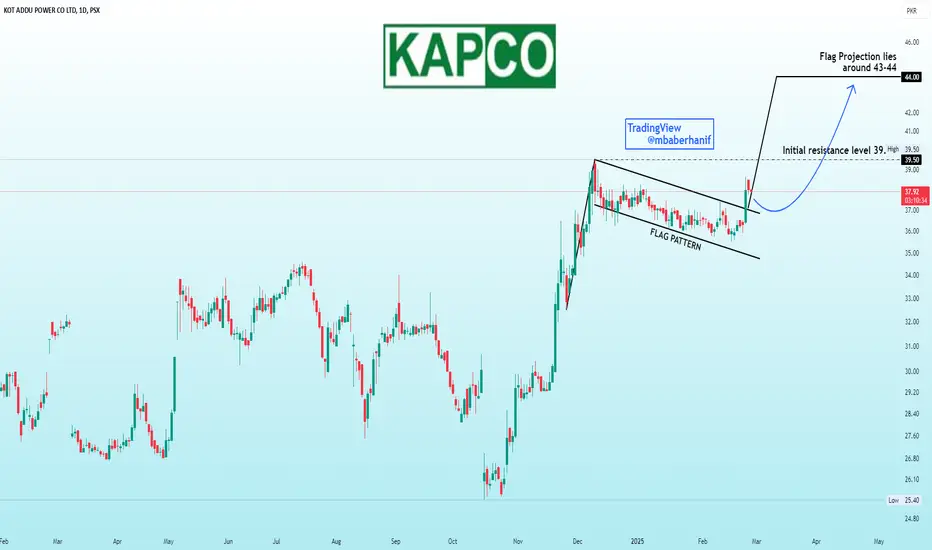
The stock displays a bullish flag pattern on strong volume, trading confidently above both the 20 and 200-day EMAs, suggesting robust upward momentum. Previous session shows a break out of the flag and price closed +2.45% above it. Initial resistance lies around 39.50 which is the formation of double top pattern from where short term rejection can be seen. However, a decisive break above the resistance level will confirm the continuation of the bullish trend and flag projection lies around 43-44.
Feragatname
Bilgiler ve yayınlar, TradingView tarafından sağlanan veya onaylanan finansal, yatırım, işlem veya diğer türden tavsiye veya tavsiyeler anlamına gelmez ve teşkil etmez. Kullanım Şartları'nda daha fazlasını okuyun.
Feragatname
Bilgiler ve yayınlar, TradingView tarafından sağlanan veya onaylanan finansal, yatırım, işlem veya diğer türden tavsiye veya tavsiyeler anlamına gelmez ve teşkil etmez. Kullanım Şartları'nda daha fazlasını okuyun.