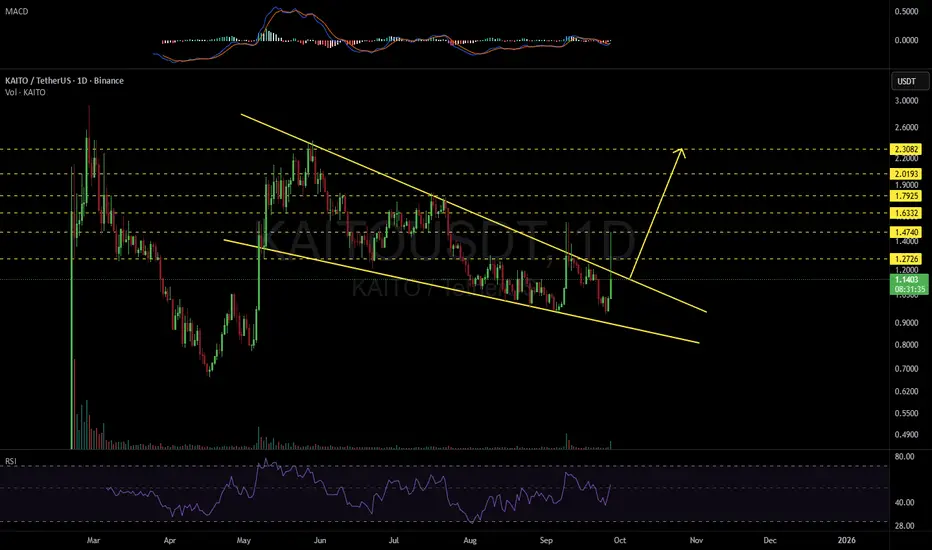
#KAITO is moving inside a falling wedge pattern on the daily chart. Volume has increased and RSI and MACD are turning bullish. #KAITO is on the verge of breaking out. If that happens, the potential targets are:
🎯 $1.2726
🎯 $1.4740
🎯 $1.6332
🎯 $1.7925
🎯 $2.0193
🎯 $2.3082
⚠️ Always remember to use a tight stop-loss and follow proper risk management.
🎯 $1.2726
🎯 $1.4740
🎯 $1.6332
🎯 $1.7925
🎯 $2.0193
🎯 $2.3082
⚠️ Always remember to use a tight stop-loss and follow proper risk management.
Feragatname
Bilgiler ve yayınlar, TradingView tarafından sağlanan veya onaylanan finansal, yatırım, alım satım veya diğer türden tavsiye veya öneriler anlamına gelmez ve teşkil etmez. Kullanım Koşulları bölümünde daha fazlasını okuyun.
Feragatname
Bilgiler ve yayınlar, TradingView tarafından sağlanan veya onaylanan finansal, yatırım, alım satım veya diğer türden tavsiye veya öneriler anlamına gelmez ve teşkil etmez. Kullanım Koşulları bölümünde daha fazlasını okuyun.