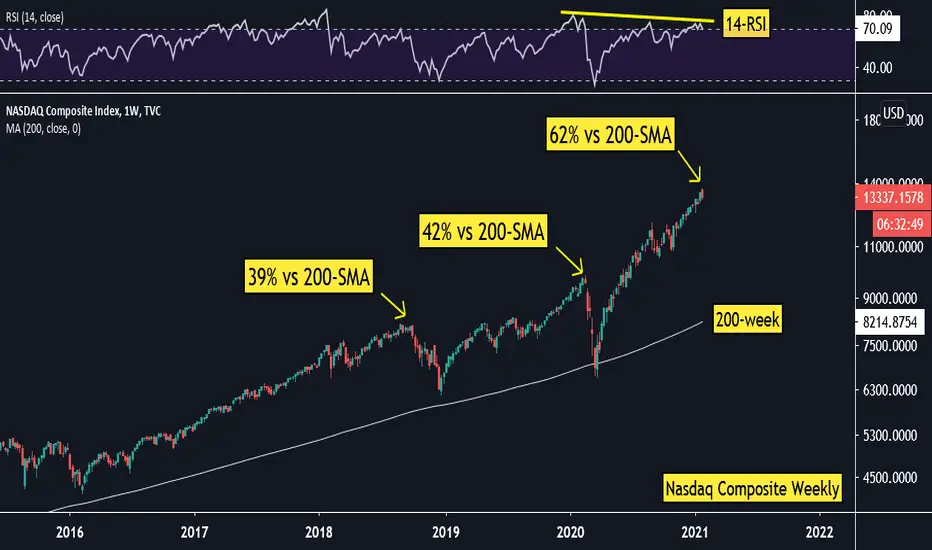
Technology sector earnings remain fairly strong and there’s ample liquidity being provided by the US Federal Reserve, however it may be worth noting that the index trades 62% above it’s 200-week SMA. Prior extensions: +42% (Feb 2020) & 39% (Oct 2018). Should the index close at current levels or lower, the candle structure would be a ‘dark cloud cover’ as per the weekly chart. In addition, the weekly chart RSI has developed lower highs (negative divergence). While it may drift a few points higher, the risk to reward does not appear attractive from a buy/long perspective. Caution to those who are overly optimistic on US Technology shares. Last Close: 13337
Feragatname
Bilgiler ve yayınlar, TradingView tarafından sağlanan veya onaylanan finansal, yatırım, alım satım veya diğer türden tavsiye veya öneriler anlamına gelmez ve teşkil etmez. Kullanım Koşulları bölümünde daha fazlasını okuyun.
Feragatname
Bilgiler ve yayınlar, TradingView tarafından sağlanan veya onaylanan finansal, yatırım, alım satım veya diğer türden tavsiye veya öneriler anlamına gelmez ve teşkil etmez. Kullanım Koşulları bölümünde daha fazlasını okuyun.