Chart & Instrument:** India Tourism Development Corp. Ltd. (ITDC) - NSE, 1D Timeframe
Analysis:
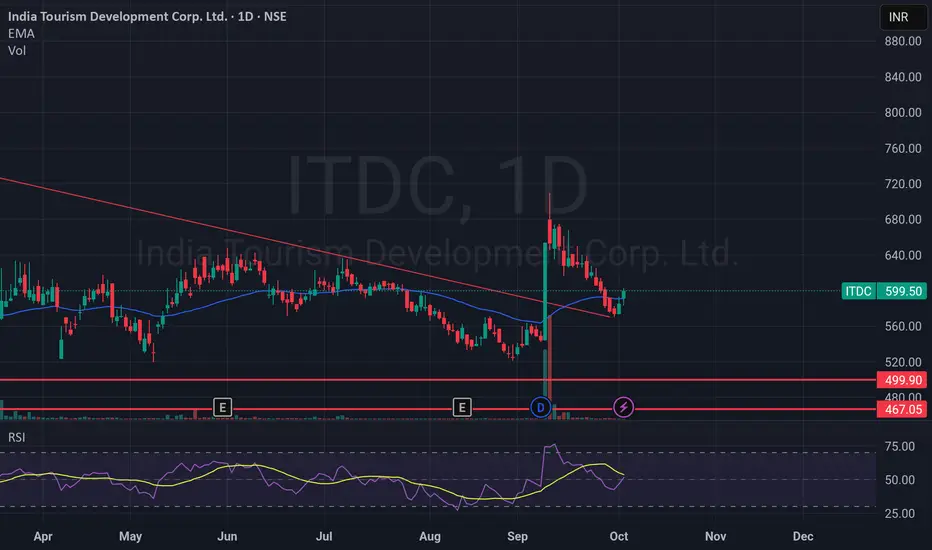
ITDC is exhibiting strength as it tests a key resistance level, poised for a potential continuation of its primary uptrend. Here's a breakdown of the technical picture:
Established Uptrend: The stock has been in a sustained uptrend since April 2025, rallying from a low of ₹467 to current levels near ₹600.
Bullish Momentum: price has closed at ₹599.50, comfortably above the key Exponential Moving Average (EMA) of ₹591.13, confirming near-term bullish momentum.
Neutral RSI: The RSI reading of ~53 is in neutral territory, indicating there is plenty of room for the stock to run before becoming overbought.
Key Resistance: The immediate and critical hurdle is the recent high of ₹603. A decisive break and close above this level are crucial for the next leg up.
Trade Idea & Prediction:
We anticipate a bullish breakout above the ₹603 resistance
Trigger: A confident break and daily close above ₹603.
Profit Target 1: ₹640 (Initial target based on previous swing highs).
Profit Target 2: ₹. 680 (Extended target, aligning with the upper boundary of the trend channel).
Stop Loss: ₹580 (A break below this key support level would invalidate the bullish setup and signal a short-term pullback).
Disclaimer :This is not financial advice. Always conduct your own research (DYOR) and manage your risk appropriately.
#ITDC #NSE #StockMarket #Trading #TechnicalAnalysis #Breakout #Investing
Analysis:
ITDC is exhibiting strength as it tests a key resistance level, poised for a potential continuation of its primary uptrend. Here's a breakdown of the technical picture:
Established Uptrend: The stock has been in a sustained uptrend since April 2025, rallying from a low of ₹467 to current levels near ₹600.
Bullish Momentum: price has closed at ₹599.50, comfortably above the key Exponential Moving Average (EMA) of ₹591.13, confirming near-term bullish momentum.
Neutral RSI: The RSI reading of ~53 is in neutral territory, indicating there is plenty of room for the stock to run before becoming overbought.
Key Resistance: The immediate and critical hurdle is the recent high of ₹603. A decisive break and close above this level are crucial for the next leg up.
Trade Idea & Prediction:
We anticipate a bullish breakout above the ₹603 resistance
Trigger: A confident break and daily close above ₹603.
Profit Target 1: ₹640 (Initial target based on previous swing highs).
Profit Target 2: ₹. 680 (Extended target, aligning with the upper boundary of the trend channel).
Stop Loss: ₹580 (A break below this key support level would invalidate the bullish setup and signal a short-term pullback).
Disclaimer :This is not financial advice. Always conduct your own research (DYOR) and manage your risk appropriately.
#ITDC #NSE #StockMarket #Trading #TechnicalAnalysis #Breakout #Investing
Feragatname
Bilgiler ve yayınlar, TradingView tarafından sağlanan veya onaylanan finansal, yatırım, işlem veya diğer türden tavsiye veya tavsiyeler anlamına gelmez ve teşkil etmez. Kullanım Şartları'nda daha fazlasını okuyun.
Feragatname
Bilgiler ve yayınlar, TradingView tarafından sağlanan veya onaylanan finansal, yatırım, işlem veya diğer türden tavsiye veya tavsiyeler anlamına gelmez ve teşkil etmez. Kullanım Şartları'nda daha fazlasını okuyun.