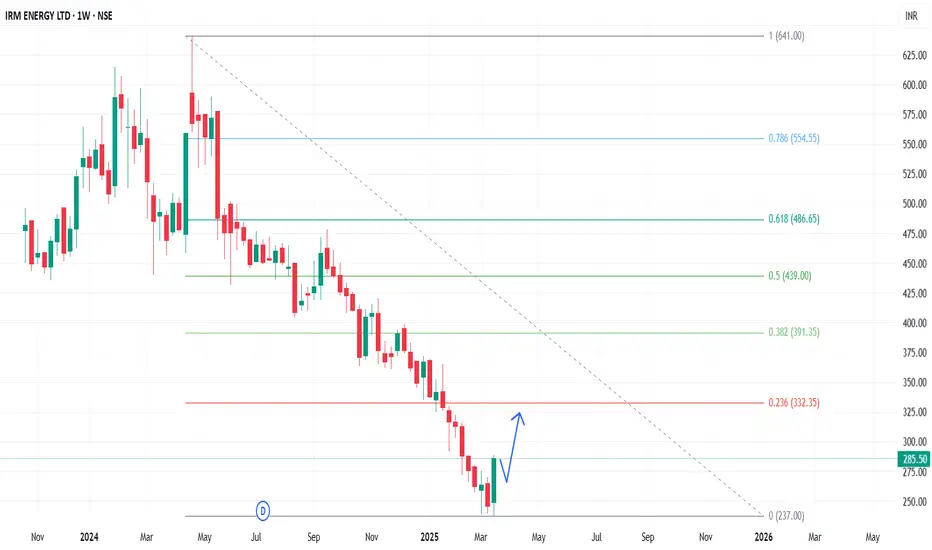
In the Weekly Chart of IRMENERGY ,
we can see that; it has given a W shape recovery from 240 levels.
Let it create a halt candle and then enter with SL & Targets.
Expected momentum is shown in chart.
we can see that; it has given a W shape recovery from 240 levels.
Let it create a halt candle and then enter with SL & Targets.
Expected momentum is shown in chart.
Feragatname
Bilgiler ve yayınlar, TradingView tarafından sağlanan veya onaylanan finansal, yatırım, işlem veya diğer türden tavsiye veya tavsiyeler anlamına gelmez ve teşkil etmez. Kullanım Şartları'nda daha fazlasını okuyun.
Feragatname
Bilgiler ve yayınlar, TradingView tarafından sağlanan veya onaylanan finansal, yatırım, işlem veya diğer türden tavsiye veya tavsiyeler anlamına gelmez ve teşkil etmez. Kullanım Şartları'nda daha fazlasını okuyun.