📈 1-Week Performance Snapshot
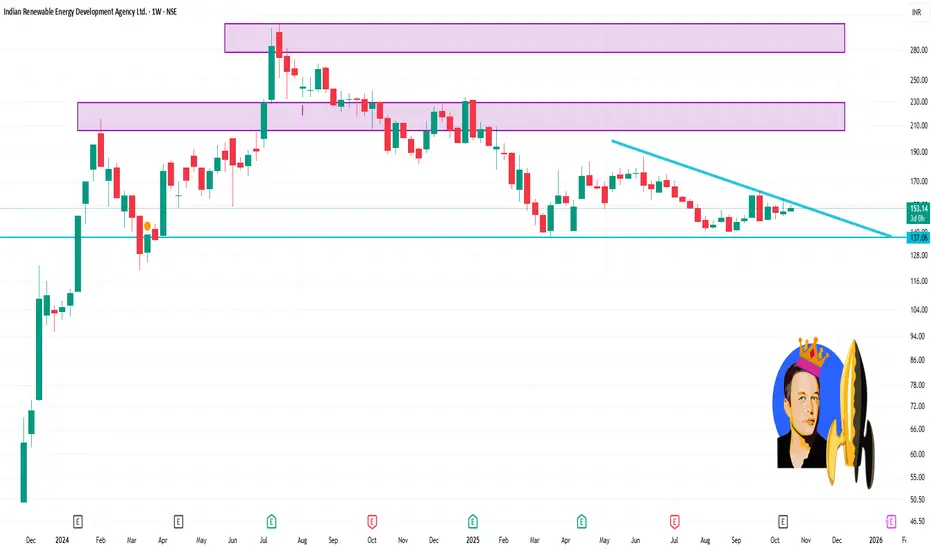
Current Price: ₹153.20
1-Week Change: Approximately +0.07%
1-Month Change: Approximately -1.92%
3-Month Change: Approximately -5.12%
1-Year Change: Approximately -30.65%
📊 Recent Trading Activity
October 20, 2025: Opened at ₹151.54, reached a high of ₹154.98, and closed at ₹153.42.
October 17, 2025: Opened at ₹153.00, reached a high of ₹153.38, and closed at ₹151.05.
October 15, 2025: Closed at ₹153.29 after reporting a net profit of ₹549.33 crore for Q2 FY26.
🔍 Technical Indicators
52-Week Range: ₹137.01 – ₹234.29
Market Capitalization: Approximately ₹43,079.56 crore
P/E Ratio: Approximately 23.49
Debt-to-Equity Ratio: Approximately 5.41
Dividend Yield: 0.00%
İlgili yayınlar
Feragatname
Bilgiler ve yayınlar, TradingView tarafından sağlanan veya onaylanan finansal, yatırım, alım satım veya diğer türden tavsiye veya öneriler anlamına gelmez ve teşkil etmez. Kullanım Koşulları bölümünde daha fazlasını okuyun.
İlgili yayınlar
Feragatname
Bilgiler ve yayınlar, TradingView tarafından sağlanan veya onaylanan finansal, yatırım, alım satım veya diğer türden tavsiye veya öneriler anlamına gelmez ve teşkil etmez. Kullanım Koşulları bölümünde daha fazlasını okuyun.