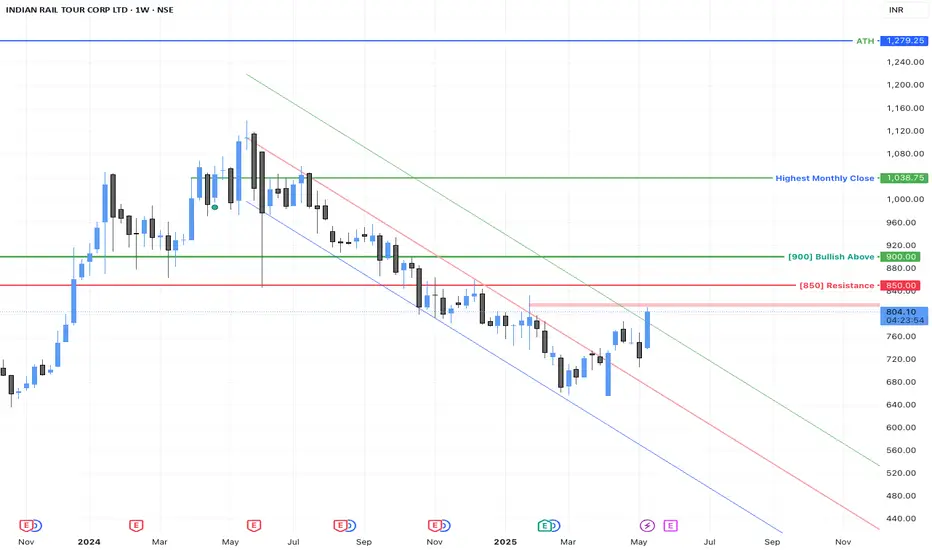
IRCTC weekly chart confirmed a breakout from the channel it was trading for the last one year.
Short term resistance around 815.
Look for signs of reversal near 850.
The stock will turn bullish only after a strong close above 900 (will small investors get a chance here?). After 900, target is only upto 1000 - if the stock needs to move higher, it needs to consolidate for few months.
Disclaimer: Only for educational purpose - not a buy / sell recommendation.
Feragatname
Bilgiler ve yayınlar, TradingView tarafından sağlanan veya onaylanan finansal, yatırım, alım satım veya diğer türden tavsiye veya öneriler anlamına gelmez ve teşkil etmez. Kullanım Koşulları bölümünde daha fazlasını okuyun.
Feragatname
Bilgiler ve yayınlar, TradingView tarafından sağlanan veya onaylanan finansal, yatırım, alım satım veya diğer türden tavsiye veya öneriler anlamına gelmez ve teşkil etmez. Kullanım Koşulları bölümünde daha fazlasını okuyun.