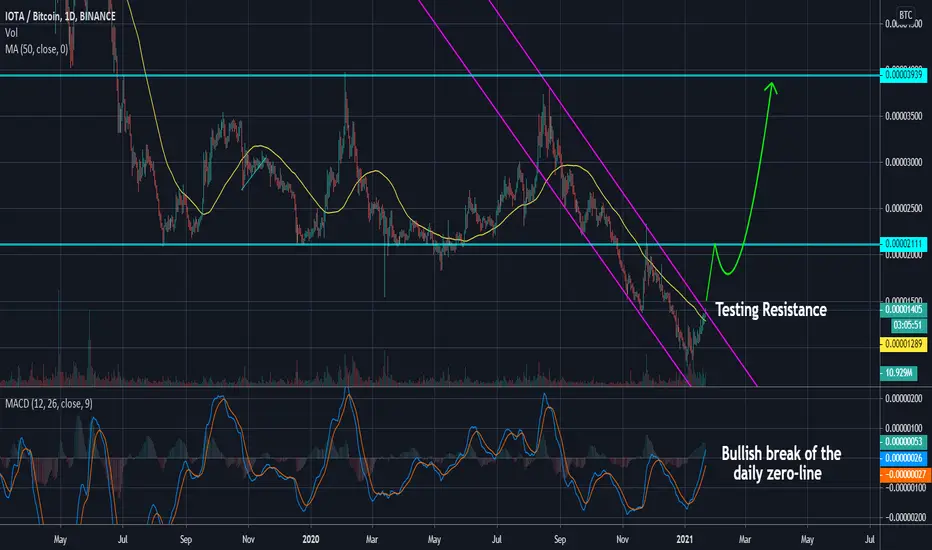
Take a quick look at the daily chart for IOTA/BTC. The price has been in a descending channel since August of 2020 and lost 79% of its value. But since then, the price action has shown a strong bullish reversal taking out the MA50 and is now testing resistance. If we can break out here, I could see the price jumping very quickly. The MACD has cleared the zero-line which is also bullish, especially on the daily time frame. Get ready!
Not
Feragatname
Bilgiler ve yayınlar, TradingView tarafından sağlanan veya onaylanan finansal, yatırım, işlem veya diğer türden tavsiye veya tavsiyeler anlamına gelmez ve teşkil etmez. Kullanım Şartları'nda daha fazlasını okuyun.
Feragatname
Bilgiler ve yayınlar, TradingView tarafından sağlanan veya onaylanan finansal, yatırım, işlem veya diğer türden tavsiye veya tavsiyeler anlamına gelmez ve teşkil etmez. Kullanım Şartları'nda daha fazlasını okuyun.