Güncellendi
IOSTBTC
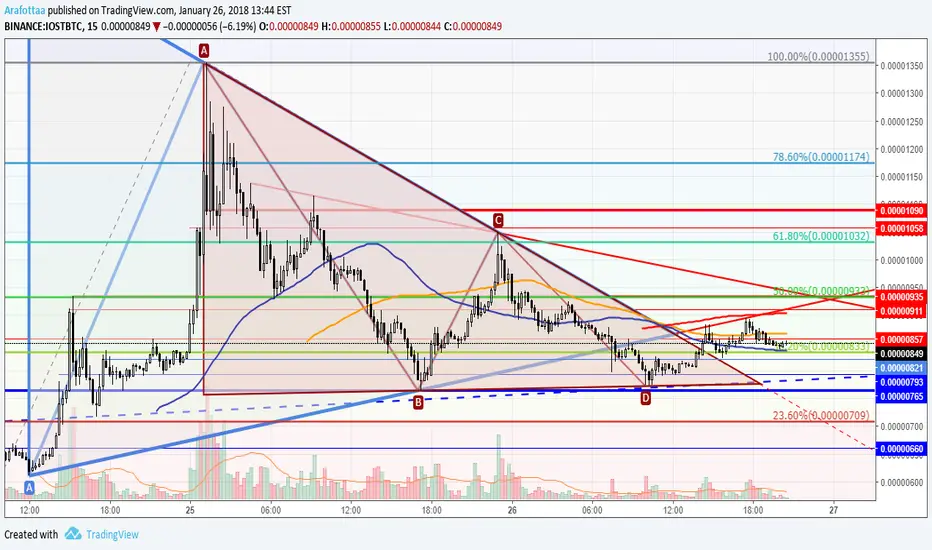
The price broke the channel on the old chart https://www.tradingview.com/chart/IOSTBTC/IxAgiQk1-IOSTBTC/
, the big triangle and the uptrend, but its rebounded above the 0.00000765 level the bottom of the small triangle to broke the triangle and the " 38% Fibonacci " to test the uptrend " bottom line of the big triangle ", but its failed to close over it, So in my opinion the price will try to test " 38% Fibonacci " again to rebound from it to 0.00000911 level.
If the price close under 0.00000821 it will go to 0.00000793 to rebound from it, If the price keep over the " 0.00000857 ", it will go to 0.00000911 to test the uptrend and the downtrend.
If the price close over " 50% Fibonacci 0.00000933 ", it will go to 0.00001090 level.
Not
The price rebounded from 0.00000796 level above the mentioned level to create third point on the uptrend.Feragatname
Bilgiler ve yayınlar, TradingView tarafından sağlanan veya onaylanan finansal, yatırım, işlem veya diğer türden tavsiye veya tavsiyeler anlamına gelmez ve teşkil etmez. Kullanım Şartları'nda daha fazlasını okuyun.
Feragatname
Bilgiler ve yayınlar, TradingView tarafından sağlanan veya onaylanan finansal, yatırım, işlem veya diğer türden tavsiye veya tavsiyeler anlamına gelmez ve teşkil etmez. Kullanım Şartları'nda daha fazlasını okuyun.